infographics

One of the best reasons to do website optimization is for the wins, when you’ve found a change that delivers real revenue to the bottom line.
But before you celebrate, check out this infographic for Marshall Downy’s sobering presentation at Which Test Won’s The Live Event. The event was held in Austin, Texas, The Conversion Capital of the World.
Marshall is with Build.com and gave several examples of post test analysis that changed the decisions he would make based on the pure test data.
What is post-test analysis? It’s what comes after you’ve completed a split test or multivariate test and have a winning change.
The problem is that we often can’t test the right metric to determine if a winner is actually helping the business. A typical example of this is products with long sales cycles. You can’t really test much if you’re waiting six months to see which leads close. You can increase the lead conversion rate, but you’ll always wonder if the lead quality was the same.
Another example is subscription services. Your test may show you how to get more subscribers, but what if the cancellation rate goes up?
Marshall lists the following types of post-test analysis to help us evaluate the true impact of our test results.
1. Customer Satisfaction Scores – If the customers aren’t as satisfied, it may not matter if you’re selling more.
2. Return Rate – If significantly more people are returning the product, increased sales may not have been good for profits.
3. Profitability – I can increase your conversion rates by slashing your prices, but will that really help the business?
4. Customer Lifetime Value – An important metric for subscription and repeat-purchase businesses.
5. Brand- and Category-specific sales – What if we increase sales of one product line at the cost of another. Also see “Cannibalism.”
6. Signup to Purchase Rate – You may get more triers, but are they turning into buyers?
Marshall didn’t share his slides, but here is my Instagraphic infographic from his presentation.
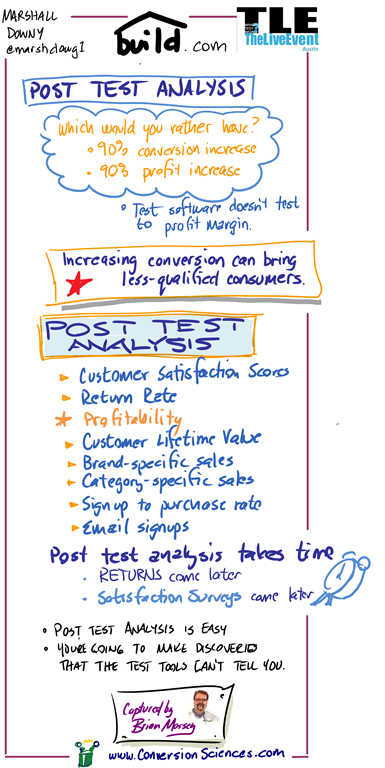
WTW TLE Post-Test Analysis Instagraph Marshall Downy

CLICK TO ENLARGE


Choosing the right price for your product can be stressful and confusing: Pick a low price and you’ll earn too little from your sales, pick a high price and you’ll sell only a few products.
So, what is the best pricing practice for my product?
The following infographic by Blog Growth will show you 7 of the best pricing strategies that will help raise your sales and increase your profit!
Science of Pricing

Should I waste my time on Facebook advertising or throw all my eggs into the blogging basket this year? What social media marketing trends do I need to integrate into my marketing?

The 2014 Social Media Marketing Industry Report holds results from over 2,800+ marketers. These experts share their experience with new and rising trends in social media marketing. The following infographic will answer marketers questions concerning where to focus their efforts in social media marketing this year.

Some relevant takeaways from the following infographic and Social Media Examiner article:

  • Over half of the marketers (58%) surveyed chose original written content as their most important form of social media content.
  • 68% of marketers plan to increase their future use of blogging.
  • Only 6% of marketers podcast, with 28% wanting to learn more about it.
  • 68% of marketers are using social media for 6 hours or more a week.

Enjoy and share!

social media examiner marketing trends infographic

Social media marketing trends for 2014 from Social Media Examiner.

Looking to gain more from your library of original content? Breath new life into your webinars and start generating leads today.

Color preferences are deeply rooted emotional responses that seem to lack any rational basis, yet the powerful influence of color rules our choices in everything from the food we eat to the clothes we wear to the cars we buy.


  • One study found that magazine readers recognize full-color ads 26% more often than black-and-white ads.
  •     

  • 92.6% of people say the visual dimension is the #1 influencing factor affecting their purchase decision (over taste, smell, etc.).
  •     

  • 2 out of 3 consumers will not buy a large appliance unless it comes in their favorite color.

Color has a powerful psychological influence on the human brain. Others have used color to their advantage and now you can do the same. Check out this infographic by our friends at KISSmetrics.

How Colors Affect Conversions
Source: How Colors Affect Conversions – Infographic

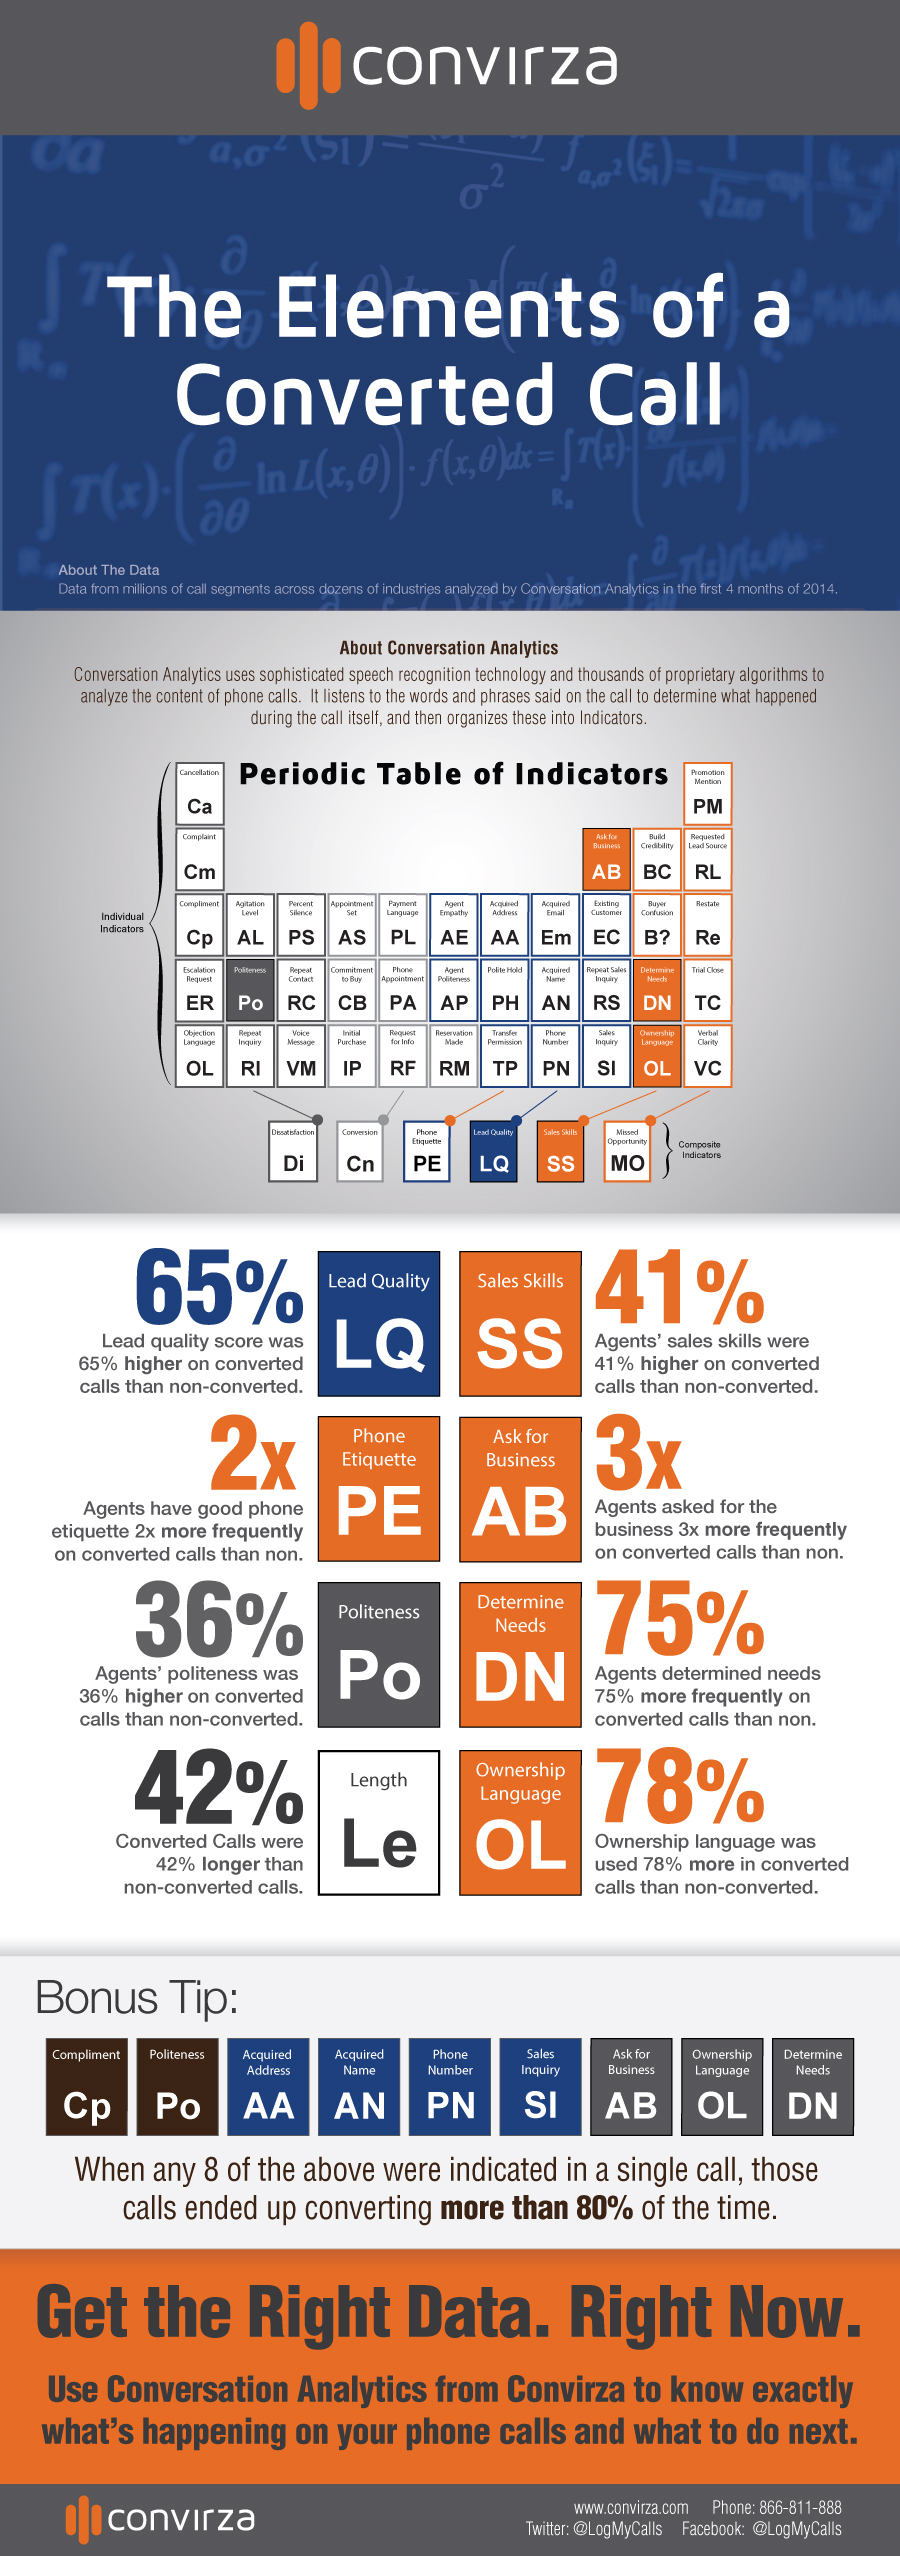
Here we thought we were the only ones who loved a good periodic table. Data collected from Convirza based on millions of phone calls analyzed in the first quarter of 2014 answers the critical question: what are the differences between a converted call and a non-converted call?
McKay Allen shared the results from this study in this incredible infographic. Some interesting facts you will find:

  • Agents asked for the business 3x more frequently on converted calls than non.
  • Converted calls were 42% longer than non-converted calls.
  • Lead quality score was 65% higher on converted calls than non.

Please share and enjoy.
Infographic, Logmycalls, converted calls

The Elements of a Converted Call

Conversion Sciences shows you how to get phone leads in our free Webinar with Convirza.

Checkout abandonment rates stand at an average of 67.4%.
This eye opening statistic reveals that a significant amount of online businesses are letting valuable sales slip through their fingers due to errors within the checkout stage itself. The modern day consumer is spoiled by choice, they can easily compare prices, they judge a website and brand within seconds and they will make quick judgments on whether to make a purchase or not with any slight site error or cause for doubt leading to a loss of interest, and lost sales.
Online brands must work increasingly harder to encourage their consumers to make a purchase. Brands must understand how their consumers respond to their website design and layout as well as offering top customer service, quality products and competitive prices – not an easy challenge.
Vouchercloud has developed this infographic to help online businesses gain an understanding of what puts consumers off from making a purchase – leading to checkout abandonment. It gives an insight into the mind of the ever demanding online consumer in a bid to help businesses improve their sales.
Consumer Psychology and eCommerce Checkouts
About the Author:
Emma works for vouchercloud. She works with brands to plan and develop effective coupon marketing campaigns which will boost profits and increase brand exposure. She enjoys all aspects of marketing and the challenges of producing a successful campaign which will be well received by consumers. Her key responsibilities are to develop and launch these campaigns with her team. You can reach vouchercloud on Twitter & Facebook.

This is a guest post by Ivan Serrano.
The phrase “too long; didn’t read” has entered the lexicon of internet users worldwide, highlighting the importance of keeping things brief, so that’s what we’ll do here.

Now more than ever, a quality video can often do a better job at getting clicks to your site and getting sales than any other form of marketing.
Now more than ever, a quality video can often do a better job at getting clicks to your site and getting sales than any other form of marketing. The reasoning is simple: people are less likely to be distracted while watching and listening to a video, compared to text, where there’s no need to pause for fear of missing something, one can just tab over to respond to a message and never tab back.
If you want to keep a customer’s attention and turn idle curiosity into hard sales, social video is the platform to use to get it done. Whether you brave the masses of YouTube or take this advice to the extreme and market your business through Vine, get acquainted with the major social video channels with our graphic below by 1800numbernow.com.

About the Author

Ivan Serrano, a journalist and business enthusiast, enjoys sharing his knowledge within the business communities through his writing. In addition to covering social media marketing, he also likes to discuss globalization, business communications, and developing technology.

Call tracking is what happens BEFORE the call. Conversation Analytics is what happens ON the call.
The Convirza (formerly LogMyCalls) Conversation Analytics uses sophisticated speech recognition technology and hundreds of thousands of proprietary algorithms to extract data from phone calls. McKay Allen shared the results from those Conversation Analytics in this incredible infographic.
Some interesting takeaways:

  • If an employee asks for the business, the caller is 10.4 X likely to convert.
  • 46% of all sales inquiries are missed opportunities.
  • 6% of calls results in caller dissatisfaction.

Millions of calls are being processed by LogMyCalls. This infographic provides high level data about all of the calls analyzed in Q1. Enjoy and share!

Conversation Analytics: Data from Every Call Analyzed in Q1

Here’s a webinar that shows you how to  get quality phone calls with our webinar.

Do Facebook posts, Tweets, and YouTube videos convert anything into sales? Are we wasting our time? Is there really any point in social commerce at all?

To better understand how social media is impacting the eCommerce industry, Shopify analyzed data from 37 million social media visits that led to 529,000 orders. In the process, they uncovered loads of interesting statistics that you need to see.  Some surprising facts include:


  • 85% of all orders from social media belong to Facebook.
  •     

  • Vimeo and YouTube beat out Pinterest, Instagram, AND Twitter in conversions. Video content consistently converts at 1.16%.
  •     

  • Social orders drop by 10-15% on the weekend.

Social CommerceCourtesy of Conversion Sciences Web Optimizers

© Copyright 2007 - 2024 • Conversion Sciences • All Rights Reserved
Conversion Sciences® and Conversion Scientist® are
federally registered trademarks of Conversion Sciences LLC.
Any unauthorized use is expressly prohibited.