tools

Can you send a daily email to a business-to-business email list? How often can I email my B2B list? Check out these 4 lessons learned.

One of my favorite conversion strategies is the second chance. The second chance only comes when I have a way to continue the conversation; to get someone to come back again and let me make my case again.

There is no better second chance channel than email.

When entrusted with an email address, and permission to continue the conversation, I have one, two, three or more chances to persuade a prospect to reconsider.

In a business-to-business situation — the considered purchase — in which a decision will be made over a period of weeks or months, email is a true friend. And if it is executed with respect, it is a friend to those struggling with a purchase decision.

The question is, how many second chances am I going to take?

Five Emails an Hour

I tell companies that they can send email as often as their content allows them.

I once got five emails from American Airlines within the space of an hour. Did I unsubscribe? Did I feel spammed? The emails were telling me the status of a flight I was booked on as its departure time and gate changed. The emails were completely relevant to my situation, and were welcome.

If we were to stand by our statement that businesses can send as often as their emails’ relevance allows, we need to understand the dynamics of a high-frequency email campaign.

How Often Can I Email my B2B List: An Email a Day Experiment

The goal of this experiment was to examine the following hypotheses:

  1. Sending email would outperform social media marketing.
  2. Sending frequent email would significantly increase my conversion rate.
  3. Sending frequently would cause an unacceptable number of my subscribers to unsubscribe.
  4. Sending frequent email would reduce my ability to deliver email due to spam reports.

a. The List

We chose a selection of 2000 names from my house list. This list consists of contacts made through personal interactions, meetings and consultations. It is primarily a business-to-business email list.

I would call the list a “semi-warm” list having received email from me only quarterly. This list had received emails on January 11 and April 30. The experiment began September 7.

Your list could easily be generated from social media traffic or search engine traffic.

b. The Content

Because of the frequent nature of these emails, it was important that they provide some value and be entertaining. This proved to be a significant challenge.

Each email followed the following formula:

  • A non-promotional subject line
  • Relevant copy
  • Link to relevant content online or registration for a live event
  • Offers varied, including an invitation to subscribe to my mailing list, registration for a live workshop and an invitation to a Webinar on writing for landing pages.

Subject lines included “Are you the victim of the Email Invisibility Ray?,” “Social Media: Marketing from my La-Z-Boy,” and “Why eight-year-olds beat me at Chess.”

3. The Frequency

Emails were sent daily, Tuesday through Friday for two consecutive weeks. Eight emails we sent in all.

High Frequency Email Campaign Test Results

1. Email Performance vs. Social Media

We’ve had relatively good luck using social media to drive traffic to my site. However, in Figure 1, you can see that the email resulted in significant increases in traffic, even outperforming our summer social media experiment.

How often can i email B2B list? Traffic sources overview: email effect on site traffic.

Figure 1 • Traffic sources overview: email effect on site traffic.

Hypothesis: “Sending email would outperform social media marketing.” True

One interesting note is the rise in search engine traffic at the time of the email. This underscores that click-through rate is only a partial measurement of email effectiveness.

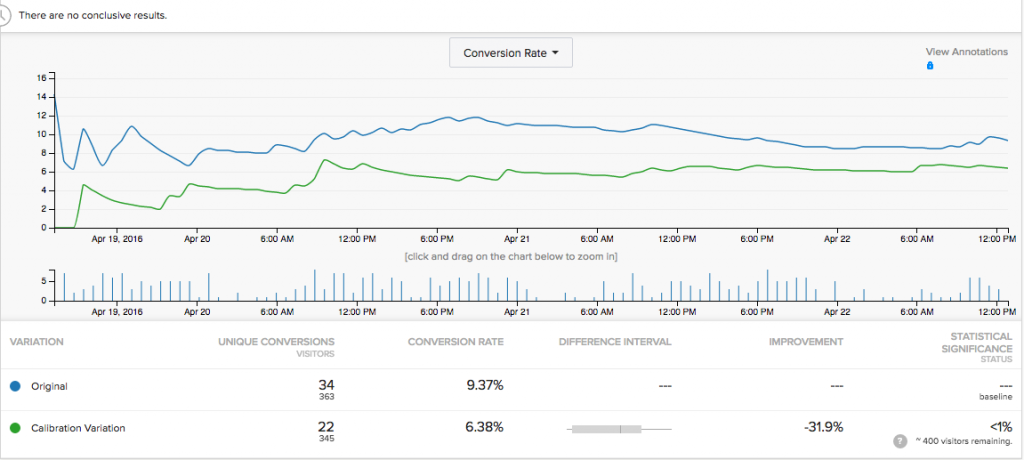
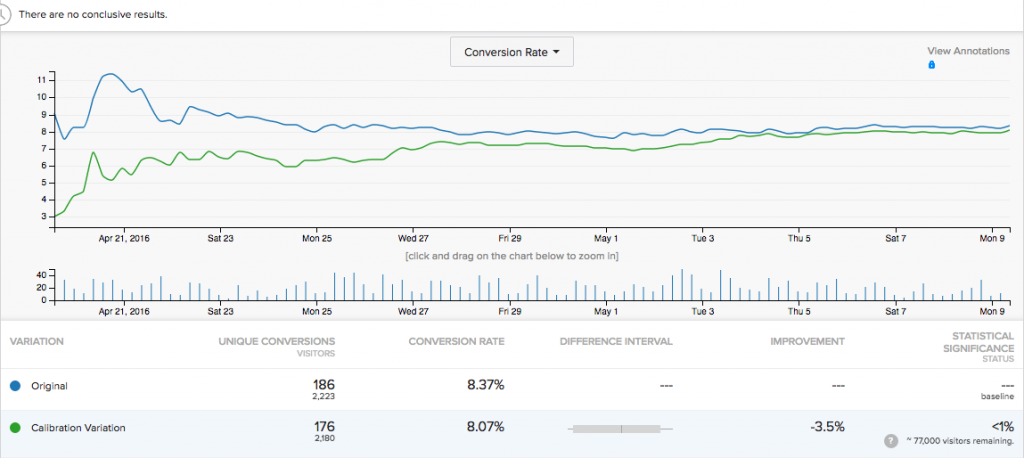
2. Increased Conversion Rate

It is probably not surprising that sending email to a targeted list is going to result in more conversions. However, keep in mind that my social media networks are also quite well-targeted.

As expected, both conversions and conversion rates for new subscribers increased. We can also attribute thirteen (13) workshop registrations to this email series, generating almost $1300 in sales.

Just looking at new email subscribers, the conversion rate for our social media experiment were 2.5%. For the period of this email, conversion rates were 7.6%.

Email frequency's effect on conversion rate.

Figure 2 • Emails’ Effect on Conversion Rate.

Hypothesis: “Sending frequent email would significantly increase my conversion rate.” True

3. Opt-out Rates

This was the metric I was most interested in examining. How would unsubscribe rates change over the course of the experiment?

Email frequency effect on deliverability. Open rate, Click-through rate and Bounce Rate for each drop.

Figure 3 • Open rate, Click-through rate and Bounce Rate for each drop.

I consider an unsubscribe rate of 1% or less acceptable and expected in any email that asks the reader to take action. So, I got pretty nervous as unsubscribe rates rose to 3.2%, and stayed well above 1%. Over the course of the experiment, 15% of the list unsubscribed.

There are two ways to look at this:

  1. We lost 15% of our prospects.
  2. We identified the 85% of list members that are interested and qualified.

If my goal with this list was primarily to sell, I would consider the 15% loss to be acceptable and even desirable. This is called Shaping your list.

However, my goal is to evangelize conversion and to educate, so the opt-outs represents a pretty significant loss of reach.

From a brand perspective, there were very few negative comments, and many positive ones.

Given the opt-out rates, would I do this again. The answer is a resounding yes.

Hypothesis: “Sending frequently would cause an unacceptable number of my subscribers to unsubscribe.” False

4. The Effect on Deliverability

The other negative effect that frequent emails can have is an increase in spam reports.

For most service providers, deliverability is the inverse of the bounce rate. If my emails are reported as spam, we would see an increase in bounces. Intuitively, when shaping a list, you expect bounce rates to drop quickly as bouncing addresses are removed from the list.

For our experiment, the bounce rate began at 2.5% but quickly dropped, leveling at an imperceptible 0.06%.

One reader was kind enough to let me know that they had “spammed” my email. I used the site MXToolbox.com to see if my domain had been placed on any black lists. However, it would be our Email Service Provider (ESP) that took the hit if spam was reported. This is one big value of an ESP. They keep themselves – and you – off of black lists.

How often can i email B2B list? Effect on opt-out rates. Unsubscribe Rates for the Email Series.

Figure 4 • Unsubscribe Rates for the Email Series.

Another measure of reader interest is open rates.

Email service providers count the number of times a special image is downloaded to establish open rates. Since many people have images turned off in their email client, the open rate is not an accurate measure of actual opens.

However, I would interpret a steady drop in open rates as a sign that the list is becoming fatigued with my communications. Open rate can also be a good indicator of the quality of your subject line.

Open rates were relatively flat, dropping on Fridays.

Overall, I believe that few of my readers reported these emails as spam.

I attribute this positive outcome to the non-promotional nature of the copy, even though the emails were clearly promoting our email list, workshop and webinar.

Hypothesis: “Sending frequent email would reduce my ability to deliver email due to spam reports.” False

How Often Can I Email my B2B List Conclusions

With some simple analytics in place, we can pretty easily establish the ideal frequency of our email campaigns. Based on these results, we should be sending email more frequently. You will probably come to the same result. However, we tested a certain kind of email with this experiment; an email that is informational and entertaining as well as promotional. This style of email requires a bit more work and creativity on our part.

The payoff is quite clear.

Email is a more effective channel in a B2B sale than is social media. It is also a great way to get more out of your search engine and advertising traffic. When you get an email address, you get a second chance at the sale. And a third, fourth and fifth chance.

For the complete content of the emails sent during this experiment, and the results of some split tests conducted, visit.

Interested in setting up your own conversion marketing laboratory? Run your own secret science experiments? Brian Massey, the Conversion Scientist, will tell you how.

Sometimes it’s better to ask forgiveness than permission

Warning: this information will make you a more successful marketer, but may also put your immediate job in jeopardy.

To be a true hero, you must have two things:

  1. An arch nemesis
  2. A secret

Unfortunately for those of us in marketing, our nemesis is often the organization in which we work; that Dilbert inspired, plodding structure full of people that think they know how to market. Such a beast is often resistant to our most powerful weapons, such as positive results.

The best way to defeat such a daunting foe is through patience and stealth. As marketers, we must build our strength, our knowledge and our skills.

How to set up your conversion marketing laboratory.

How to set up your conversion marketing laboratory.

Your Secret Conversion Marketing Laboratory

I propose that you consider building your own secret conversion marketing laboratory, your own Xanadu. This is the place you go to explore new marketing strategies and ask questions that others may not have the guts to ask.

Questions like:

  • What if we used more copy on our landing pages?
  • What if we tried an interesting headline?
  • Would audio or video increase our conversion rates?
  • Will social media work in our business?

These are the questions that take time to sell internally, especially when you don’t have the data. These are the concepts that IT is designed to thwart. It’s time to unshackle yourself. Build your own conversion laboratory.

Rules of Engagement

Now, as heroes, we want to do good in the world. This means doing no harm to our organization’s brand. We don’t want to work against our organizations already plodding attempts to communicate.

We want to minimize cost – most of us aren’t Bruce Wayne – and maximize automation. This will make our time in the lab most productive.

I cover all of the guidelines in my Search Engine Land column Setting Up Your Own Conversion Lab, Part 1.

Why Do We Need A Conversion Marketing Laboratory?

Because conversion marketing is a momentum game. It requires trying things to find out what works best. It requires rapid question-test-analyze-question cycles. And sometimes we have to test unintuitive assumptions to understand our audience.

Without the lab, there are blocks to momentum.

IT has their gatekeepers that slow our testing cycles. Management wonders why we aren’t writing a press release or blog post.

While most marketing departments think they know best, our lab lets our visitors tell us what they want. This is powerful knowledge. There are some big wins to be found in the lab, especially at the beginning.

The Secret Conversion Laboratory

Your secret conversion lab should be set up with a few best practices to be successful.

Consistent measurement trumps accurate measurement. Conversion marketing means making decisions based on data. Analytics provide that data.

We aren’t interested in an analytics implementation that is accurate down to the visitor. Instead, we want analytics that are sufficiently correlated to reality.

This is scientist-speak for “when things change, our measurement changes by about the same amount.” When more people visit, our metric “visits” goes up by about the same percentage. It mirrors reality.

Don’t waste your precious time trying to get accuracy in measurement. Good enough is good enough.

Most analytics systems are easy to set up, or are competently integrated into most of the online services you’ll be using in your lab.

Equipment cost must be “under the expense line”. The secret lab is, by design, not going to be a budget line item. That defeats the purpose.

Instead, you need to select tools that are free or cheap enough to purchase and implement without going through the budget process. They need to be expensible.

Avoid IT obstacles. The equipment you use in your conversion lab must not require IT resources to set up and use. IT is too often a bottleneck.

We will be selecting tools that almost any marketer can use. With a little practice and some training videos, you will be able to implement almost any test you can imagine.

It should be highly automated. We must get our marketing duties done with excellence, so our conversion lab can’t take a large chunk of our precious time. If you’re off in the lab for hours at a time, people will begin to wonder. It draws attention.

We will be looking for tools that automate the lab, and solutions that collect and aggregate data for us.

Your efforts should not harm the live web site. Our goal is to become better at marketing for our companies. As such, we should do no harm. Our lab should not:

  • Violate company brand guidelines
  • Compete with corporate sites on the search engines
  • Take significant financial chances
  • Violate compliance requirements in regulated industries
  • Circumvent or disregard your company’s privacy and permission policies

Basically, we want to do small tests, learning things we can use to help the company sell more and dominate online.

Beakers, Bunsen Burners and Mass Spectrometers

We are fortunate to have many of the tools needed in our lab available for free or at low cost.

You will need tools to:

  • Create and host content of many types.
  • Put measurement equipment in place
  • Heat up your experiments with traffic sources
  • Select the right content management system to host your experiments

Cape and tights are not required

It may be tempting the done a hero’s uniform once you begin to feel the power of what you learn in your lab. Honestly, It’s best to stay under the radar.

Let us know which tools you find in your lab in the comments, and please share any interesting results you get from your experiments.

Read on if you are interested in learning how to build your own conversion optimization team or contact us for a free consultation.

Originally published on the Search Engine Journal

Heatmaps are just the first step to obtaining useful insights on your website visitors. Today we’ll find out how heatmaps helped increase prospective student inquiries by 20% for a University and have a chat with Andrew Michael of Hotjar. Find out what he has to say.

Andrew Michael | Understanding Your Users: Leveraging Tools to Grow Your Website

Subscribe to the Podcast

iTunes | Spotify | Stitcher | Google Podcasts | RSS

Resources and links discussed

How Heatmaps Helped Increase Prospective Student Inquiries by 20%

We were looking at the heatmap report for the website of Northcentral University, a non-profit online university headquartered in Arizona.

Reading a heatmap report is like looking at a weather radar, but instead of blobs of green, red and yellow showing us where rain is falling around us, a heatmap report shows us where visitors are clicking on a web page.

And it was raining clicks in an unexpected spot on the NCU website.

Specifically, visitors were clicking on one of the fields in the middle of a form, and only on that field. Not the name field, not the email field. The majority of them weren’t completing the form.

So, why were visitors so interested in this one field?

It was an important question, as this form was the primary invitation to get more information on the University. It was on almost every page, ready to start a more in-depth conversation with any visitor.

The field visitors were clicking on was “program of interest”, a dropdown field that listed the degrees offered by NCU. It was meant as a way for prospective students to tell NCU which degree program they were interested in.

These prospective students were using it as an information source.

While the copy on the page was regaling visitors on the value of NCUs one-on-one learning, it’s 100% doctoral professors and it’s diversity, visitors were telling us that they had one question first.

Do you offer a degree program I’m interested in?

At least, this was the hypothesis. So we designed a test.

At the top of every page, we placed a dropdown menu that listed the university’s programs, just like that on the form. When a degree program was selected, we took them to the part of the site that described that degree program.

Half of NCUs visitors would see this dropdown. The other half would not. They’d have to use the dropdown in the form.

When we measured the results, the visitors who saw the dropdown in the page were 20% more likely to fill out the form completely, requesting information.

This indicated that the change would increase prospective student inquiries by 20%, a very significant improvement in the key metric for the site.

The current site offers a complete section designed to help visitors find a degree program they’re interested in.

This is something that we would not have been able to find any other way than through a heatmap report. It doesn’t show up in analytics. No one would have complained.

This is the power of a class of report called user intelligence reports.

Anyone who knows how to read rain chances from a weather radar can use this kind of report. More and more of us are doing this.

These reports are surprisingly easy to generate and the tools are inexpensive.

You can bring people to websites all day long but if it’s not optimized and it’s not user friendly and you’re going to lose all day and you just can end up throwing money down the drain.

Leading the way is a company called Hotjar. On today’s show we’re breaking down HotJar with Andrew Michael. A tool focused on helping you understand your users. Andrew got into marketing because he’s intrigued by psychology – understanding what drives people’s decisions.

An Insightful Chat with Andrew Michael from Hotjar

Intended Consequences podcast with Hotjar's Andrew Michael

Intended Consequences podcast with Hotjar’s Andrew Michael

Time is precious for overburdened marketers. On this show, we seek to understand which tools are truly valuable, and which are just giving us “interesting” insights.

We install something like Hotjar on every one of our client sites when optimizing.

Tools like Hotjar are a part of what I call ‘the golden age of marketing’. These tools are continually evolving, getting easier to use and less expensive.

These are the tools that buy you more time to be creative, ground breaking and successful.

We start off the podcast talking about all of the things Hotjar brings to the table under a single subscription. Then we talk about the outcome of leveraging tools like this – how do they actually empower marketers serve their online prospects better?

Listen to the Podcast. It’s well worth it.

When You Get Back To The Office

I’m not a shill for Andrew. I just know these tools are a great value and easy to learn.

When you get back to the office, i recommend that you do a trial of Hotjar. Add it to your homepage, or one of your “money” pages where you ask visitors to take action. Setup a heatmap report on it.

Let it run for a few days, and then look at the scroll report. This report tells you how far visitors are scrolling on your page. This is one of the first things we look at when we start analyzing our clients’ sites.

Where is the report turning blue? This is the place on the page that visitors stop reading. Look in the blue area. What key content are they missing?

If more than half of your page is blue, you have a scroll problem. Visitors aren’t being engaged enough to get through your content.

Reasons for this include: false bottoms, where visitors think the page ends when it doesn’t. It can mean that your content isn’t engaging them enough high on the page. It can mean that you’re not handling a key objection.

Your strategies include moving key content to the top of the page, putting arrows, chevrons and “v”s on the page to tell visitors to keep going, or re-thinking the story you tell on this page.

Don’t be discouraged. This is progress! Next, share this report with your design team and see what they think.

This is how pages get better and businesses grow.

You can get all these links discussed on this week’s episode in our shownotes. One thing to remind you all of is that Hotjar is a freemium model so it’s one you can definitely

Alright scientists, that’s it for this week.

Andrew Michael | Understanding Your Users: Leveraging Tools to Grow Your Website

Subscribe to the Podcast

iTunes | Spotify | Stitcher | Google Podcasts | RSS

Don’t miss the first episode of the first Podcast season, where we chat with Mouseflow, a user-behavior analytics tool and cover recordings, heatmaps, funnels. Plus, how to manage helicopter executives.

Collecting Qualitative Data on Your Visitors

Subscribe to the Podcast

iTunes | Spotify | Stitcher | Google Podcasts | RSS

Resources and Links Discussed

Intended Consequences Podcast Season 1 Episode 1: Key Takeaways

  1. Exit Intent: Not sure what this means? You’ll learn about that and why it matters.
  2. What Happens When a Site Bug Goes Unchecked: You’ll hear stories on the impact a site bug can have on your website – and we’re talking a $1.2 million impact.
  3. Tips on Conversation with Executives: Gain knowledge and tips from Evan on how to have conversations with your marketing executives.

Excerpts from our Conversation with Mouseflow

Avoid the Bias

This stuff really fascinates me just because it’s a psychological. It’s diving into the minds of of your visitors. And one thing that I always encourage people to do when they’re using Mouseflow on their website is PLEASE FOR THE LOVE OF GOD DO NOT go in with any bias. You have to be willing to test and identify ways that you can improve your form or specific parts of your Web site.

The Add-to-Cart Bug

This is going to have to remain anonymous, so I can’t share the company. But there is e-commerce store in America that uses Mouseflow and they were recording 100 percent of all visitors. So lots of data coming in. We’re talking millions and millions of sessions per month. And there was a pretty serious bug / error that was deployed live onto the Web site after they had finished a redesign. And Mouseflow picked it up. They had notifications set to send to one of their product marketers e-mails whenever a JavaScript error occurred.

All of the sudden at 2:00a.m. on Monday night their e-mail just starts getting absolutely blown up. It turned out that there was an Add to Cart button that was not working on about 40% of their product pages.

It was a huge huge error.

Mouseflow estimated it ended up being like $400K revenue loss. So, it ended up being a serious deal . And if that had gone further unnoticed, obviously this would have stretched into the millions of dollars.

Get ready, Marketers

“So I would I think that’s one of the most exciting things for a marketer who finally grabs this tool installs it, because they’re about to get the data they need to have a really really interesting meetings.”

Conversion Sciences Podcast with Mouseflow, a user-behavior analytics tool.

Conversion Sciences Podcast with Mouseflow, a user-behavior analytics tool.

Helicopter Executives

That executive who doesn’t feel comfortable with the work that a marketer has done, because that marketer doesn’t have any data, will come in and change things based on their experience with a customer their experience or their own preference.

In other words executives are coming in with all their biases and making changes to a campaign, and that’s really frustrating to a marketer marketing team who’s worked hard on a redesign, to have a sample size of one person come nin and upend those assumptions.

Celebrating Design

“But there’s something to be said for installing this tool before you launch a redesign, and then going in and celebrating, with heatmap and session recordings, where the redesign has really improved things. That’s going to get the design team and the UX team more interested in working with you.”

It’s going to make your boss look good because he or she shepherded this fantastic redesign. And then you can go and say here’s the next things we can be improving on.”

Multivariate testing offers high-traffic websites the ability to find the right combination of features and creative ideas to maximize conversion rates. However, it is not sufficient to simply throw a bunch of ideas into a pot and start testing. This article defines what a multivariate test is, explains the advantages and pitfalls of this kind of testing, and offers some ideas for the future.

Nothing gives you confidence and swagger like AB testing. And nothing will end your swagger faster than bad data. In order to do testing right, there are some things you need to know about AB testing statistics. Otherwise, you’ll spend a lot of time trying to get answers, but instead of getting answers, you’ll end up either confusing yourself more or thinking you have an answer, when really you have nothing. An A/A test ensures that the data you’re getting can be used to make decisions with confidence.

What’s worse than working with no data? Working with bad data.

We’re going to introduce you to a test that, if successful will teach you nothing about your visitors. Instead, it will give you something that is more valuable than raw data. It will give you confidence.

What is an A/A Test

The first thing you should test before your headlines, your subheads, your colors, your call to actions, your video scripts, your designs, etc. is your testing software itself. This is done very easily by testing one page against itself. One would think this is pointless because surely, the same page against the same page is going to have the same results, right?

Not necessarily.

After three days of testing, this A/A test showed that the variation identical to the Original was delivering 35.7% less revenue. This is a swagger killer.

This A/A Test didn't instill confidence after three days.

This A/A Test didn’t instill confidence after three days.

This can be cause by any of these issues:

  1. The AB testing tool you’re using is broken.
  2. The data being reported by your website is wrong or duplicated.
  3. The AA test needs to run longer.

Our first clue to the puzzle is the small size of the sample. While there were over 345 or more visits to each page, there were only 22 and 34 transactions. This is too small by a large factor. In AB testing statistics, transactions are more important than traffic in building statistical confidence. Having fewer than 200 transactions per treatment often delivers meaningless results.

Clearly, this test needs to run longer.

Your first instinct may be to hurry through the A/A testing so you can get to the fun stuff – the AB testing. But that’s going to be a mistake, and the above shows why.

An A/A test serves to calibrate your tools

An A/A test serves to calibrate your tools

Had the difference between these two identical pages continued over time, we would call off any plans for AB testing altogether until we figured out if the tool implementation or website were the source of the problem. We would also have to retest anything done prior to discovering this AA test anomaly.

In this case, running the A/A test for a longer stretch of time increased our sample size and the results evened out, as they should in an A/A test. A difference of 3.5% is acceptable for an AA test. We also learned that a minimum sample size approaching 200 transactions per treatment was necessary before we could start evaluating results.

This is a great lesson in how statistical significance and sample size can build or devastate our confidence.

An A/A Test Tells You Your Minimum Sample Size

The reason the A/A test panned out evenly in the end was it took that much time for a good amount of traffic to finally come through the website and see both “variations” in the test. And it’s not just about a lot of traffic, but a good sample size.

  • Your shoppers on a Monday morning are statistically completely different people from your shoppers on a Saturday night.
  • Your shoppers during a holiday seasons are statistically different from your shoppers on during a non-holiday season.
  • Your desktop shoppers are statistically different from your mobile shoppers.
  • Your shoppers at work are different from your shoppers at home.
  • Your shoppers from paid ads are different from your shoppers from word of mouth referrals.

It’s amazing the differences you may find if you dig into your results, down to specifics like devices and browsers. Of course, if you only have a small sample size, you may not be able to trust the results.

This is because a small overall sample size means that you may have segments of your data allocated unevenly. Here is an sample of data from the same A/A test. At this point, less than 300 sessions per variation have been tested. You can see that, for visitors using the Safari browser–Mac visitors–there is an uneven allocation, 85 visitors for the variation and 65 control. Remember that both are identical. Furthermore, there is an even bigger divide between Internet Explorer visitors, 27 to 16.

This unevenness is just the law of averages. It is not unreasonable to imagine this kind of unevenness. But, we expect it to go away with larger sample sizes.

You might have different conversion rates with different browsers.

You might have different conversion rates with different browsers.

Statistically, an uneven allocation leads to different results, even when all variations are equal. If the allocation of visits is so off, imagine that the allocation of visitors that are ready to convert is also allocated unevenly. This would lead to a variation in conversion rate.

And we see that in the figure above. For visitors coming with the Internet Explorer browser, none of sixteen visitors converted. Yet two converting visitors were sent to the calibration variation for a conversion rate of 7.41%.

In the case of Safari, the same number of converting visitors were allocated to the Control and the calibration variation, but only 65 visits overall were sent to the Control. Compared this to the 85 visitors sent to the Calibration Variation. It appears that the Control has a much higher conversion rate.

But it can’t because both pages are identical.

Over time, we expect most of these inconsistencies to even out. Until then they often add up to uneven results.

These forces are at work when you’re testing different pages in a AB test. Do you see why your testing tool can tell you to keep the wrong version if your sample size is too small?

Calculating Test Duration

You have to test until you’ve received a large enough sample size from different segments of your audience to determine if one variation of your web page performs better on the audience type you want to learn about. The A/A test can demonstrate the time it takes to reach statistical significance.

The duration of an AB test is a function of two factors.

  1. The time it takes to reach an acceptable sample size.
  2. The difference between the performance of the variations.

If a variation is beating the control by 50%, the test doesn’t have to run as long. The large margin of “victory”, also called “chance to beat” or “confidence”, is larger than the margin of error, even at small er sample sizes.

So, an A/A test should demonstrate a worst case scenario, in which a variation has little chance to beat the control because it is identical. In fact, the A/A test may never reach statistical significance.

In our example above, the test has not reached statistical significance, and there is very little chance that it ever will. However, we see the Calibration Variation and Control draw together after fifteen days.

These identical pages took fifteen days to come together in this A/A Test.

These identical pages took fifteen days to come together in this A/A Test.

This tells us that we should run our tests a minimum of 15 days to ensure we have a good sample set. Regardless of the chance to beat margin, a test should never run for less than a week, and two weeks is preferable.

Setting up an A/A Test

The good thing about an A/A test is that there is no creative or development work to be done. When setting up an AB test, you program the AB testing software to change, hide or remove some part of the page. This is not necessary for an A/A test, by definition.

For an A/A test, the challenge is to choose the right page on which to run the test. Your A/A test page should have two characteristics:

  1. Relatively high traffic. The more traffic you get to a page, the faster you’ll see alignment between the variations.
  2. Visitors can buy or signup from the page. We want to calibrate our AB testing tool all the way through to the end goal.

For these reasons, we often setup A/A tests on the home page of a website.

You will also want to integrate your AB testing tool with your analytics package. It is possible for your AB testing tool to be setup wrong, yet both variations behave similarly. By pumping A/A test data into your analytics package, you can compare conversions and revenue reported by the testing tool to that reported by analytics. They should correlate.

Can I Run an A/A Test at the Same Time as an AB Test?

Statistically, you can run an A/A test on a site which is running an AB test. If the tool is working well, than your visitors wouldn’t be significantly affected by the A/A test. You will be introducing additional error to your AB test, and should expect it to take longer to reach statistical significance.

And if the A/A test does not “even out” over time, you’ll have to throw out your AB test results.

You may also have to run your AB test past statistical significance while you wait for the A/A test to run its course. You don’t want to change anything at all during the A/A test.

The Cost of Running an A/A Test

There is a cost of running an A/A test: Opportunity cost. The time and traffic you put toward an A/A test could be used to for an AB test variation. You could be learning something valuable about your visitors.

The only times you should consider running an A/A test is:

  1. You’ve just installed a new testing tool or changed the setup of your testing tool.
  2. You find a difference between the data reported by your testing tool and that reported by analytics.

Running an A/A test should be a relatively rare occurrence.

There are two kinds of A/A test:

  1. A “Pure” two variation test
  2. An AB test with a “Calibration Variation”

Here are some of the advantages and disadvantages of these kinds of A/A tests.

The Pure Two-Variation A/A Test

With this approach, you select a high-traffic page and setup a test in your AB testing tool. It will have the Control variation and a second variation with no changes.

Advantages: This test will complete in the shortest timeframe because all traffic is dedicated to the test

Disadvantages: Nothing is learned about your visitors–well, almost. See below.

The Calibration Variation A/A Test

This approach involves adding what we call a “Calibration Variation” to the design of a AB test. This test will have a Control variation, one or more “B” variations that are being tested, and another variation with no changes from the Control. When the test is complete you will have learned something from the “B” variations and will also have “calibrated” the tool with an A/A test variation.

Advantages: You can do an A/A test without stopping your AB testing program.

Disadvantages: This approach is statistically tricky. The more variations you add to a test, the larger the margin of error you would expect. It will also drain traffic from the AB test variations, requiring the test to run longer to statistical significance.

AA Calibration Variation in an AB Test

AA Test Calibration Variation in an AB Test (Optimizely)

Unfortunately, in the test above, our AB test variation, “Under ‘Package’ CTAs”, isn’t outperforming the A/A test Calibration Variation.

You Can Learn Something More From an A/A Test

One of the more powerful capabilities of AB testing tools is the ability to track a variety of visitor actions across the website. The major AB testing tools can track a number of actions that can tell you something about your visitors.

  1. Which steps of your registration or purchase process caused them to abandon your site
  2. How many visitors started to fill out a form
  3. Which images visitors clicked on
  4. Which navigation items were most frequently clicked

Go ahead and setup some of these minor actions–usually called ‘custom goals’– and then examine the behavior when the test has run its course.

In Conclusion

Hopefully, if nothing else, you were amused a little throughout this article while learning a bit more about how to ensure a successful AB test. Yes, it requires patience, which I will be the first to admit I don’t have very much of. But it doesn’t mean you have to wait a year before you switch over to your winning variation.

You can always take your winner a month or two in and use it for PPC and continue testing and tweaking on your organic traffic. That way you get the both worlds – the assurance that you’re using your best possible option on your paid traffic and taking the time to do more tests on your free traffic.

And that, my friends, is AB testing success in a nutshell. Now go find some stuff to test and tools to test with!

About the Author


21 Quick and Easy CRO Copywriting Hacks to Skyrocket Conversions

21 Quick and Easy CRO Copywriting Hacks

Keep these proven copywriting hacks in mind to make your copy convert.

  • 43 Pages with Examples
  • Assumptive Phrasing
  • "We" vs. "You"
  • Pattern Interrupts
  • The Power of Three

"*" indicates required fields

This field is for validation purposes and should be left unchanged.


We are often guilty of writing about the AB testing process as if it was something you can jump into and start doing. We believe an AB testing program can keep you from making expensive design mistakes and find hidden revenue that your competitors are currently getting. It’s not an overnight switch, however. It takes some planning and resources.
It’s a journey not unlike that taken by many heroes throughout history and mythology. We invite you to join the ranks of heroic journeymen.
The journey looks something like this: You befriend a helpful stranger who gives you something magical. Soon, you are called to adventure by events beyond your control. When you act, you enter a strange new world and must understand it. You are set on a journey to right some wrong. Allies and helpers work with you to move past trials and tests. Your magical talisman helps you understand what to do. With patience you gather your reward and return home, the master of two worlds.
Consider this blog post a harbinger of the adventure that awaits you. Here are the things you’ll encounter on your journey.

Executive Champion: Magical Helper

Every hero story involved some kind of “supernatural help”. In the story of the Minotaur, Ariadne gave Theseus the golden string to find his way out of the Minotaur labyrinth. In Star Wars, Obi-Wan Kenobi gave Luke Skywalker a light saber showing him how to dodge blaster shots and face Darth Vader.
Each barrier in your path to an amazing AB testing program will have obstacles, and each obstacle will require a little magical help. This is the role of your executive champion. Your executive can impart to you special gifts, such as the Magical Elixir of Budget, the Red Tape Cleaver: Blessed Blade of Freedom, as well as the One Ring of Power to rule them all…but let’s not get carried away.
In my experience – and I’d like to hear yours – AB testing is not something that can be done “under the radar” until you have some successes. Use this post to guide you, prepare a presentation, and convince someone with pull to support your efforts.

Traffic: The Call to Adventure

It is when we finally have a steady, reliable stream of visitors that we are called to our hero’s journey. Traffic is like the taxes imposed by the Sherriff of Nottingham. The hero just can’t stand by and watch injustice.
Likewise, you must feel uncomfortable about having thousands of visitors coming to your site – most of them paid for – and then seeing 99% of them turn and leave. This is injustice at it’s most heartbreaking and a clear conversion optimization problem. Many companies will just up the Adwords budget to grow revenue. Heroes fight for the common visitor.
AB testing is a statistical approach to gathering data and making decisions. There is a minimum number of transactions you will want each month in order for your AB tests to reach statistical significance. In general, you can test an idea a month with 300 monthly transactions.
To see if you have the traffic and conversions, use our simple Conversion Upside Calculator. It will tell you how quickly you would expect a positive ROI on your AB testing program.

Analytics: Understanding the Unknown

Upon accepting the call to adventure, the hero will find herself in a strange new world. Here the rules she is so familiar with will no longer apply. She will see things differently. In the tale of The Frog Prince, a spoiled princess agrees to befriend a talking frog. In exchange the frog will retrieve her favorite golden ball from a deep pool. Upon making the deal, her world changes.
You, too, have lost your golden ball.
Most websites have Google Analytics, Adobe Analytics, Clicky, Mixpanel, or some other analytics package in place. I recommend that you not look at this as a scary forest full of strange tables, crooked graphs and unfathomable options. Instead, look at this as a constantly running focus group. It’s a collection of answers to your most pressing questions.
You should get to know your web analytics tools, but don’t get wrapped around the axel thinking you need to have fancy dashboards and weekly updates. That’s the work of admins.
Instead, sit down with a specific question you want to answer, and figure out how to drill deep into it.
“Where are visitors entering our website?”
“How long are they staying?”
“Which pages seem to cause the most trouble?”
“Are buyers of Product A acting different from buyers of Product B?”
“How important is site search to our visitors?”
This gives you amazing cosmic powers to make decisions that otherwise would have been coin tosses.

Hypothesis List: The Yellow Brick Road

One of our favorite hero stories is that of Dorothy and her journey through the Kingdom of Oz. This is a favorite because it has all of the elements of the hero’s journey. Our hero’s journey needs a path to follow. Just as Dorothy was told to follow the yellow brick road to Oz, our hypotheses are the yellow bricks in our path to AB testing success.
As you become more familiar with analytics, you will have many ideas sliding out of your head.

Ideas are like the slippery fish in an overflowing barrel.
Ideas are like the slippery fish in an overflowing barrel. You probably already have a lot of questions about how things are working on your site. You’ve probably collected dozens of ideas from well-meaning coworkers.
It can be overwhelming.
The magical helper for unbounded ideas is called the Hypothesis List. It is like Don Quixote’s Rocinante. It is your powerful steed on which you can rely to carry you through your journey to testing. By building out this Hypothesis List, you will eliminate ideas that aren’t testable, refine ideas that are, and rank them based on expected ROI.
If AB testing tells you which of your ideas are good ones, the Hypothesis List tells you which are most likely to be good ones.

Ideas are not Hypotheses

A Hypothesis is an “educated guess”. To be a hypothesis, an idea must be somewhat educated: informed by data, supported by experience, or born from observation. Any idea that begins with “Wouldn’t it be cool if…” is probably not a hypothesis.
When you take an idea, and try to write it into the format of a hypothesis, you quickly realize the difference. Here’s the format of a hypothesis:

If we [make a change], we expect [a desirable result] as measured by [desired outcome].

The change is a modification to copy, layout, navigation, etc. that tests a hypothesis. it is insufficient to say “Get more clicks on Add to Cart”. You must state a specific change, such as, “Increase the size of the Add to Cart button”.
The result is a desired outcome. For most tests, the desired out come is a bottom-line benefit.

  • “increase transactions”
  • “decrease abandonment”
  • “increase phone calls”
  • “increase visits to form page”

Soft results such as “increase engagement” are popular, but rarely correlate to more leads, sales or subscribers.
The outcome is usually the metric by which you will gauge the success of the test.

  • Revenue per Visitor
  • Lead Conversion Rate
  • Form Abandonment Rate

The ROI Prioritized Hyptohesis List Spreadsheet

Download your copy of the spreadsheet we use to prioritize winning test ideas.

  • List and categorize your ideas
  • Rate and rank to find “Low Hanging Fruit”
  • Place into buckets to identify key issues.

Many of your ideas will spawn several detailed hypotheses. Many ideas will simply die from lack of specificity.

Too Many Ideas

It is not unusual to have more ideas than you can manage. Nonetheless, it makes sense to capture them all. A simple Excel spreadsheet does the trick for collecting, sorting and ranking.

Too Few Ideas

It may be hard to believe, but you will run out of good hypotheses faster than you know. Plus, there are many hypotheses that will never be obvious to you and your company because as the old saying goes, “You can’t read the label from inside the bottle.”
This is where focus groups, online user testing sites, surveys, and feedback forms play an important role. Too many marketers use input from the qualitative sources as gospel truth. This is a mistake. You’re working toward an AB testing process that will let you test this input.

Ranking by Expected ROI

We recommend ranking your hypotheses so that the “low hanging fruit” bubbles up to the top. Our ROI Prioritized Hypothesis List ranks them based on four criteria, all ranked on a scale of one to five:

  1. Level of Effort: How difficult is this to test and implement?
  2. Traffic Affected: How much traffic will this hypothesis affect, and how important is that traffic?
  3. Proof: How much evidence did we see in analytics and other tools that this hypothesis really is a problem?
  4. Impact: Based on my experience and knowledge, how big of an impact do I really think this hypothesis can drive?

Once you’ve plugged a value in for these criteria for each hypothesis, add 2, 3 and 4 and subtract 1. That’s the weight of each hypothesis. The higher the weight, the lower the fruit hangs.

The Scarecrow: JavaScript Developer

Every hero has helpers, allies and maybe even a sidekick. You are no exception. Dorothy had the Scarecrow, the first ally she met on the banana-colored road to Oz. The Scarecrow had an amazing brain, but didn’t really know it.
At the end of your journey, you are going to have complete control of your website. You won’t need to put requests into IT. You will have the power to change your website for every visitor because the change happens in the visitor’s browser. Each visitor gets the same website from the server. It’s the JavaScript that instantly transforms what they see into a test treatment, something different and measureable.
Your JavaScript developer will be your Scarecrow. This person must be comfortable with JavaScript, HTML, CSS, the browser DOM and cross-browser issues. This person will enable you to make changes that put your hypotheses to the test.

The Tin Man: Designer

Dorothy was also befriended by the man who didn’t know he had a heart on the way to Oz.
You’ll want  a designer that isn’t interested in redesigning your pages. All you need is a designer who can change portions of a page. It may be a design change as simple as a new image, or as complex as a new page layout.
Avoid designers who like to add to their egos to your design.

The Lion: Copywriter

I made the copywriter the lion in this journey because writing and defending bold headlines and copy takes courage. Like Dorothy’s friend, the cowardly lion, most copywriters have been taught to write business speak to online visitors. They have PTSD from having their copy bled on by executives. This won’t work in testing.
Your copywriter needs to be able to writer for personas. He must be brave enough to create “corner copy”, or headlines that test the extremes of emotion, logic, spontaneity and deliberateness.
One of our biggest winning headlines was “Are you ready to stop lying? We can help.” It took bravery to write and defend this headline that delivered a 43% increase in leads for an addiction treatment center.

Tests and Trials: QA Methodology

Every hero is tested. Villains and the universe put obstacles in place to test the hero’s resolve. You, too, will be tested when you realize that you don’t have just one website. You have ten or twenty. Or thirty.
Your website renders differently in each browser. Safari looks different from Chrome. Internet Explorer seems to be dancing to it’s own HTML tune.
Your website renders differently on smaller screens. Smartphones, phablets, tablets and 4K monitors squeeze and stretch elements until your HTML and CSS snap.
Your website renders differently based on your connection. Fast Wi-Fi is often not available to your mobile visitors. Your development team is probably testing on fast Wi-Fi.
The permutations of these issues means that you can’t design for one site, even if you have responsive design.
Add to this JavaScript that moves things around on each of these different websites, and you have the potential to bring some of your visitors to an unusable website.
Quality Assurance, or QA is your defense against your new-found responsibility.
At Conversion Sciences, we go to the extreme of purchasing devices and computers that let us test a the most common browsers, screen sizes and operating systems.

Conversion Sciences' QA station

Conversion Sciences’ QA station


There are a number of sites that will provide simulators of a variety of devices, browsers and OSes. These have names like BrowserStack, Sauce Labs, and Litmus.
How do you know which of these you should be QAing on? Your analytics database, of course. Look it up.

Magical Help: AB Testing Tools

As we said above, your executive champion can bestow on you supernatural aids to help you in your journey. This is not the only source of magical helpers. Aladdin found the magic lamp in a Cave of Wonders.
Your magic lamp and “genie” are your AB testing tool. These marvelous tools make our agency possible. AB Testing tools have magical powers.

  • They inject JavaScript into our visitors’ browsers, allowing us to change our website without changing the backend.
  • They split traffic for us, letting us isolate individual segments of visitors to test.
  • They track revenue, leads and subscribers for us, so we know if our changes really generate more business for us.
  • They provide the statistical analysis that tells us when we can declare a winner in our tests.
  • They provide lovely graphs and reports.

The market leaders currently are Optimizely, Adobe Target, and Visual Website Optimizer (VWO). We have also used Convert.com, Maxymiser, Monetate and Marketizator to test websites.
We call these tools the “supreme court” of analytics. They control many of the variables that pollute data, and give us confidence that our changes will deliver more revenue, leads and subscribers to our clients.

The Belly of the Whale: Patience

The story of “Jonah and the Whale” appears in the Bible and Quran. In short, God asks Jonah to go to the city of Ninevah. Jonah hems and haws. So God arranges for Jonah to be swallowed by a big fish. After three days of apologizing, the whale spits Jonah out, and he begins his God-ordained journey.
It turns out that the belly of the whale is a theme in many hero myths. Like them, you will find yourself waiting and wondering as your tests slowly gather data. Some will go more slowly than others. Pressures from executives will mount. You must persevere.

Do not rush to make decisions, even if it looks like your test is going to deliver you a winner. Let the process run its course.

The Reward: Revenue, Subscribers and Leads

In the end, you will have winning hypotheses and losing hypotheses. Because you won’t launch the losers and will push live the winners, you’ll begin to collect your boon, your reward, your Benjamins.
Be sure to show off a bit. Toot your own horn. Heroes come home to fanfare and celebration. Let your organization know what your AB testing program is doing for them and revel in the glow of success.

Master of Two Worlds: AB Testing Program

Your journey has taken you from magical helpers to reward. Along the way you entered a new world, learned its rules, overcame tests and trials, and used magic to win the day.
You are now Master of Two Worlds: Master of the old world of pray marketing, and Master of the new world of data-driven marketing. This will be a career builder and a business boon.
This is everything you need to build your AB testing program. Conversion Sciences offers a ready-made turnkey conversion optimization program. Ask for a free strategy consultation an carve months off of your hero’s journey.

The AB Testing JavaScript that powers tests is powerful, but can lead to many unintended consequences.

Conversion Sciences offers a pretty amazing ability to our clients: A completely “turnkey” conversion optimization testing service. By “turnkey” we mean that our clients don’t need to do anything to their website in order for us to analyze the site, design creative, develop code, QA, test, review and route traffic to winners.
Why is this? Don’t we need new pages designed? Interactions with IT? Release schedules? Sprints?
The reason we have this “phenomenal cosmic power” is that our AB testing tools take control of each visitor’s browser. The changes are made on the visitors’ devices, so the website doesn’t have to be modified.
Well, not until we’ve verified that a change brings in big money.
While this makes us feel all high and mighty, it comes with a big drawback.

The Magic and Mania of JavaScript

All of the major browsers have a scripting engine built into them. It allows programs to be run inside the browser. The programming language used is called JavaScript. It’s JavaScript that makes websites interactive. Website developers use JavaScript to make text accordion when you click a heading. It is used to rotate images in a carousel.
Unfortunately, developers use JavaScript to do silly things, like parallax animations.

This unnecessary "parallax" motion may be reducing the conversion rates for this site.

This unnecessary “parallax” motion may be reducing the conversion rates for this site.

And then there’s this.

Don't use JavaScript animations just because you can.

Don’t use JavaScript animations just because you can.

Yes, JavaScript gives us the power to make our websites harder to use.

JavaScript is Used in AB Testing Software

Our developers use JavaScript to modify a website when you visit it. The AB testing software “injects” our JavaScript into the browser when the page is loaded.

First the web page is loaded as is from the webserver. Some visitors will see only this default version of the website.

For some visitors, our JavaScript is then injected and executed. The AB Testing software determines who sees the default web page and who will see a variation of the page.

Phenomenal Cosmic AB Testing Power

We can change almost anything about a page using AB Testing JavaScript.

We change the headline to something different.

We change the order of a rotating carousel, or slider.

We hide elements…

AB Testing flicker can be cause by simply removing elements.

AB Testing flicker can be cause by simply removing elements.

and insert them as well.

We insert video.

We completely change the look of a website.

We completely change the look and feel of this site. The test showed the white site performed the same as the brown site.

We completely change the look and feel of this site. The test showed the white site performed the same as the brown site.

AB Testing JavaScript is a Step Toward Personalization

If we wanted, we could deliver a different website to every visitor who arrives. If you’re thinking “personalization” at this point, then you have an idea of where our industry is heading.

AB testing produces the data that makes personalization truly work.

Here are my instagraphic notes from a presentation by Chris Gibbins at Conversion Conference 2016 on using AB testing and personalization.

Instagraphic shows why and how to use AB Testing for personalization.

Instagraphic shows why and how to use AB Testing for personalization.

AB Testing Flicker, Flash, Blink and Ghosting

Unfortunately, JavaScript can introduce an error into our AB tests. Because we always load the website “as it is” on the server first, there is a possibility that the visitor will see the original for a fraction of a second before our changes get executed.
This has been called a “flash”, “flicker”, and a “blink”. It can have a significant effect on test results.

With AB Testing JavaScript, Flash is not cool.

With AB Testing JavaScript, Flash is not cool.

The problem with this AB testing JavaScript flicker is that it won’t be there if a change is made permanent on the site. Our tests may say the new change generated more revenue, and we’ll change the website to make that change manifest. But there will be no flicker. This means there is another variable in our test.
Was it the new headline we tested or was it the flicker that made more people buy?


21 Quick and Easy CRO Copywriting Hacks to Skyrocket Conversions

21 Quick and Easy CRO Copywriting Hacks

Keep these proven copywriting hacks in mind to make your copy convert.

  • 43 Pages with Examples
  • Assumptive Phrasing
  • "We" vs. "You"
  • Pattern Interrupts
  • The Power of Three

"*" indicates required fields

This field is for validation purposes and should be left unchanged.


The Human Eye is Drawn to Motion

Our eyes and brains have evolved to make motion important. When something moves, our eyes and brains work hard to figure out if the thing moving is edible, if it will eat us, or if we can mate with it. Technology has moved faster than evolution. Even though we’re looking at a website, where there is no immediate source of food, fear or fornication, our lizard brains continue to favor motion.

Imagine this scenario. We are testing the text on a button. That means that for some of our visitors, the button will change. Others will see the default button text. Then we’ll see who buys the most.

The changing element on this page draws your eye, and can make the page impossible to focus on.

The changing element on this page draws your eye, and can make the page impossible to focus on.

If there is a flicker, flash or blink when the text changes, the button will be immediately more visible to those visitors who see it. More of them will see the call to action. This may make more of them consider buying than those who simply scrolled past. If this new treatment generates more revenue, we are left with the question, “Was it the text or was it the motion that created the lift in sales?”

We won’t know until we push the new text onto the server and do a post-rollout analysis to see the real lift. At this point, we may find that the text didn’t increase purchases. It’s a real bitch.

How many buttons have been change because of flicker?

AB Testing Software Tries to Eliminate Blinking

The AB testing software that we use works to eliminate this blinking and flashing. The issue is so important that Convert Insights has patented their method for eliminating “blink”.

AB testing software like Optimizely, Visual Website Optimizer, Adobe Test, and Marketizator, load asynchronously, meaning that they load our changes as the page loads. This makes it easier for changes to be made before the visitor sees the page.

How Convert Insights Eliminates “Blink”

“The first thing this snippet does is hide the body element for max. 1.2 seconds (this can be set), this prevents blinking of elements already visual on the site that load under 1.2 seconds (we have yet to get a client that loads faster than this). During the 1.2 seconds, the SmartInsert(R) technology search and replaces DOM-elements every couple of milliseconds and loops through the entire available DOM-elements in the browser of the client. After all elements are replaced the body hidden attribute is set to display the site again either at 1.2 seconds or when the signal is given that all elements have been replaced (or DOM-ready).
Everybody can see how this technology works by loading our Chrome Extension.”
— Dennis van der Heijden, Convert.com

Eliminating Flash Flicker and Blink in AB Tests

In addition to this, our developers can do things that reduce and eliminate flicker and blink. Every test you do has different issues, and so a variety of tactics can be used to address them.

Avoid Google Tag Manager

Don’t use a Tag Manager like Google Tag Manager to serve your AB testing JavaScript software tags. Add them to the page manually. Tag managers can counteract the asynchronous loading of the tool and delay when changes can be made.

Make Changes with CSS

If the change can be made with the cascading style sheets (CSS), we favor making changes with CSS over using JavaScript. CSS can make changes to an element – like an image or font – that can be applied before an element displays.

Modal Dialogs and Overlays

Modal dialogs usually don’t display until the visitor takes an action. They can be edited before they are shown without flashing.

Use a Timer for DOM Changes

All of the images, headings, copy, widgets, and forms are stored in the browser in a big database called the DOM (Document Object Model). When JavaScript makes changes to the DOM, the content on the page changes. The DOM is slow-loading, as you can imagine.

Our developers will set a timer in JavaScript to check for when a changing element is loaded. By watching for our element to be loaded, we can execute a change it before the DOM – and the page – is loaded.

For the AB Testing Software to Load Our Changes Immediately

The AB testing software provides a synchronous loading mode. Optimizely and VWO use different approaches for this.

Rethink the Test

Sometimes, we have to go back to the drawing board and design a test that doesn’t cause flash-inducing changes. We will refactor a test to eliminate items that cause a flash or flicker.

Delay Display of the Content

We can delay the display of the content until the DOM is loaded and all elements have been changed. This causes a different kind of issue, however. The visitor sees a blank page or blank section for longer if they get the page with the change.

In one case we added a spinning wheel to indicate that the page is loading.
loading_small

Insert Placeholders Using Fast CSS

When inserting elements, we’ll use CSS to insert a placeholder, then use JavaScript to modify the element after the page has loaded. This reduces redrawing of the page when elements are inserted.

We created a blank box in CSS to minimize AB Testing Flash on this mobile website.

We created a blank box in CSS to minimize AB Testing Flash on this mobile website.

Optimizing for Mobile

Mobile pages load more slowly. This is because visitors don’t always have a high-quality connection when visiting from the festival, or from inside the walls of a bank while standing in line. For mobile devices, flash can be an even bigger issues.

Fortunately, the tactics we use on the desktop also work on mobile websites. But don’t forget to QA your test treatments on 3G and 4G connections. You may find flicker and blink on mobile devices that didn’t appear on your desktop.

Great JavaScript Developers are a Must

We spend a considerable amount of our time making sure our JavaScript and CSS changes are like the “native” implementation would look.  It’s one of the things that makes testing hard. Our team has the experience to ensure your tests aren’t falling victim to flicker, flash, blink or ghosting. Best in class Developers are one of the things that help to make use the most effective Conversion Optimization Agency on the planet!

If you’d like our team to take over the effort of developing your AB tests, contact us for a free consultation and an overview of our process.

Here are several questions about applying conversion science to ecommerce sites. These questions came from the sponsors of the GP Ecommerce Summit in Bucharest, Romania.

  1. Can we consider Conversion Rate Optimization a real science?

What defines a science? The Scientific Method.

  1. Assume we know nothing about a problem
  2. Research it
  3. Develop hypotheses
  4. Select the most likely hypothesis for testing
  5. Design a test that isolates that hypothesis
  6. Run the test using sound statistical methods
  7. Evaluate with post-test analysis
  8. Draw a conclusion
  9. Use the new information to formulate new hypotheses
  10. Repeat

I’ve just described our six month Conversion Catalyst process to you. We “science the sh*t” out of websites. Without the science, we make bad decisions, emotional decisions, decisions based on superstition and myth.
There is also a component of sport in conversion optimization. We are in this to win. While we must be objective, we like to find revenue and hate when our tests are inconclusive.

  1. What are the first steps you have to take if you wish to increase your conversion rate on your e-commerce website?

My recommendation is that ecommerce sites focus on the value proposition their offering. This is a combination of your categories (what you sell), your shipping policy, your return policy and your brand.
Zappos built an amazing online brand by putting its value proposition front and center, “Free shipping both ways. 365 day return policy. Empowered customer support people.”
What is your value proposition? Fast delivery? Local manufacturing? Free installation? Donations to charity with every purchase? Emphasize it on your site, in your cart and throughout checkout.

  1. How do you create a good landing page and what are the best ways to test it?

The best landing pages keep the promise of the ad, link or post that brought the visitor there. They make an offer that matches the promise as exactly as possible. They show the product, even if it is a service or a PDF or a video series. Good landing pages provide proof points that are specific and supported by fact. Good landing pages build trust by borrowing from customers and customers. Good landing pages make the call to action the most prominent thing on the page. And good landing pages don’t add any distractions, such as social media icons, links to other pages or corporate site navigation.
This is the chemical equation for landing pages: Offer + Form + Image + Proof + Trust = Landing Page

The chemistry of the landing page

The chemistry of the landing page

  1. Can persuasive writing help you sell more online or do you need more than that? For example, how do you test a good headline?

Most of our biggest wins come from copy changes, like headlines. We are even testing different kinds of testimonials on one site to see which build the most trust. The words are very important. This is related to the value proposition I discuss above. When you learn the emotional language that brings visitors into your site, you learn something about your audience. This insight can be used anywhere.

  1. What is an important point you want to drive home?

There is a wave of ecommerce sites rushing to rebuild their sites using responsive web design (RWD). This is in part due to Google and Mobilegeddon, but few can ignore the growing influence of mobile devices on our revenue. This rush to RWD is a mistake for many businesses who will find themselves with a poorly performing mobile site and a lower conversion rate on their redesigned desktop site. Tragic.
You should embrace your mobile visitors, and there are alternatives to RWD. I’ve seen some redesign horror stories and some pretty amazing success stories. Mobile design is still too new for there to be best practices, but our testing tells us what successful mobile designs should begin to look like.

  1. How do you remember the ecommerce market in the USA from 10 years ago?

Ten years ago, we didn’t have the data tools we have today. We relied much more on qualitative research. Most of my work was building out personas, making content recommendations and working with “best practices”. Google Analytics was young. We had been using server logs to get unreliable data on visitors. Only a few years before I had written my own web analytics package to get an idea of what was working on my sites.
Today, we have amazing qualitative and quantitative tools to uncover problems with our websites. We enjoy powerful testing tools to help us determine exactly what effect our changes will have on our businesses. We are creating revenue in the laboratory using science and creativity. We have moved from the tool-building phase into the human creativity phase. It’s a very exciting time to be an online business.


What has the Conversion Scientist been reading lately?

AdExchanger: Why Do Mobile Users Not Buy On Mobile?

We believe that mobile traffic is every bit as important as desktop traffic. Many businesses walk away from their mobile traffic because it doesn’t convert well. This is a mistake.
Two points found in this article drive the point home:

  • App and Mobile Functionality (sucks)
  • Mobile Represents a Different Type of user

Spend some time on your mobile site. Don’t just create a responsive version of your desktop website.
Read more.

Marketizator: 25+ Tools That Conversion Rate Optimization Pros Can’t Ignore

I often say we’re living in a golden age of marketing, in which we can find data to answer almost any question we have. And these tools aren’t expensive. Every marketer can benefit from these tools with a little curiosity and patience.

Nielsen Norman Group: Long-Term Exposure to Flat Design: How the Trend Slowly Decreases User Efficiency

I reviewed 47 wordpress templates for a competition earlier this year. 98% of them used a “flat” design approach. Of course, we’re seeing this style of design pervade websites.
Is this a good thing? Nielsen Norman Group says we can use flat designs if we follow some smart guidelines.
Read more.
Got suggestions for what we should be reading? Share them with us!

© Copyright 2007 - 2024 • Conversion Sciences • All Rights Reserved • Conversion Scientist® is a federally registered trademark owned by Conversion Sciences. Any unauthorized use is expressly prohibited.