How an A/A Test Gives You Confidence
Nothing gives you confidence and swagger like AB testing. And nothing will end your swagger faster than bad data. In order to do testing right, there are some things you need to know about AB testing statistics. Otherwise, you’ll spend a lot of time trying to get answers, but instead of getting answers, you’ll end up either confusing yourself more or thinking you have an answer, when really you have nothing. An A/A test ensures that the data you’re getting can be used to make decisions with confidence.
What’s worse than working with no data? Working with bad data.
We’re going to introduce you to a test that, if successful will teach you nothing about your visitors. Instead, it will give you something that is more valuable than raw data. It will give you confidence.
What is an A/A Test
The first thing you should test before your headlines, your subheads, your colors, your call to actions, your video scripts, your designs, etc. is your testing software itself. This is done very easily by testing one page against itself. One would think this is pointless because surely, the same page against the same page is going to have the same results, right?
Not necessarily.
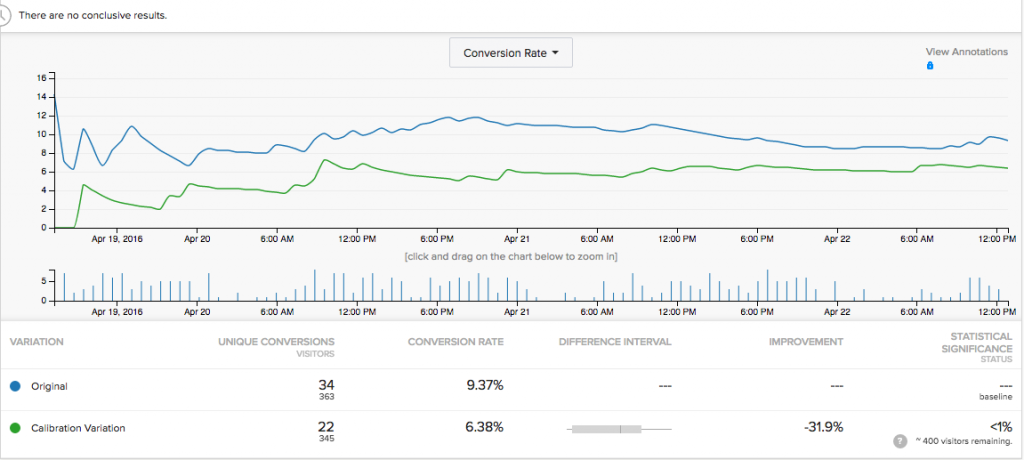
After three days of testing, this A/A test showed that the variation identical to the Original was delivering 35.7% less revenue. This is a swagger killer.

This A/A Test didn’t instill confidence after three days.
This can be cause by any of these issues:
- The AB testing tool you’re using is broken.
- The data being reported by your website is wrong or duplicated.
- The AA test needs to run longer.
Our first clue to the puzzle is the small size of the sample. While there were over 345 or more visits to each page, there were only 22 and 34 transactions. This is too small by a large factor. In AB testing statistics, transactions are more important than traffic in building statistical confidence. Having fewer than 200 transactions per treatment often delivers meaningless results.
Clearly, this test needs to run longer.
Your first instinct may be to hurry through the A/A testing so you can get to the fun stuff – the AB testing. But that’s going to be a mistake, and the above shows why.

An A/A test serves to calibrate your tools
Had the difference between these two identical pages continued over time, we would call off any plans for AB testing altogether until we figured out if the tool implementation or website were the source of the problem. We would also have to retest anything done prior to discovering this AA test anomaly.
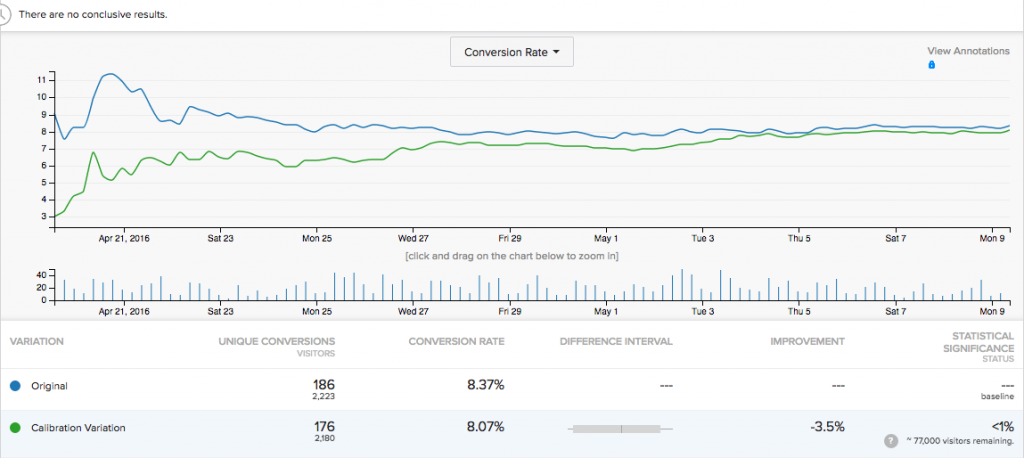
In this case, running the A/A test for a longer stretch of time increased our sample size and the results evened out, as they should in an A/A test. A difference of 3.5% is acceptable for an AA test. We also learned that a minimum sample size approaching 200 transactions per treatment was necessary before we could start evaluating results.
This is a great lesson in how statistical significance and sample size can build or devastate our confidence.
An A/A Test Tells You Your Minimum Sample Size
The reason the A/A test panned out evenly in the end was it took that much time for a good amount of traffic to finally come through the website and see both “variations” in the test. And it’s not just about a lot of traffic, but a good sample size.
- Your shoppers on a Monday morning are statistically completely different people from your shoppers on a Saturday night.
- Your shoppers during a holiday seasons are statistically different from your shoppers on during a non-holiday season.
- Your desktop shoppers are statistically different from your mobile shoppers.
- Your shoppers at work are different from your shoppers at home.
- Your shoppers from paid ads are different from your shoppers from word of mouth referrals.
It’s amazing the differences you may find if you dig into your results, down to specifics like devices and browsers. Of course, if you only have a small sample size, you may not be able to trust the results.
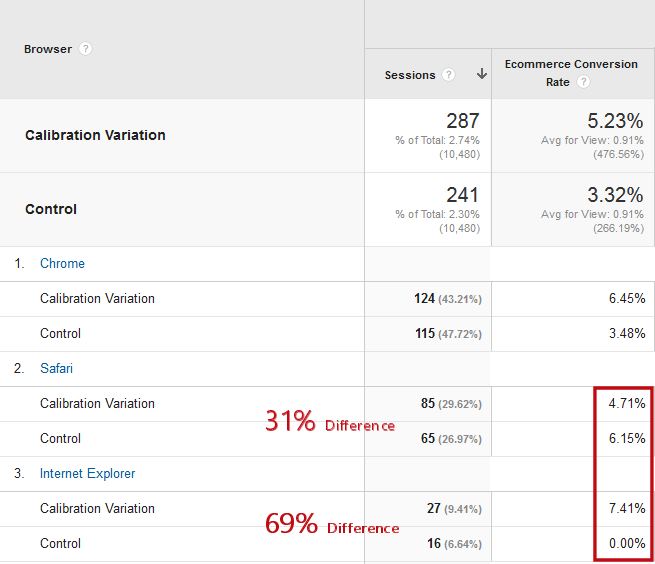
This is because a small overall sample size means that you may have segments of your data allocated unevenly. Here is an sample of data from the same A/A test. At this point, less than 300 sessions per variation have been tested. You can see that, for visitors using the Safari browser–Mac visitors–there is an uneven allocation, 85 visitors for the variation and 65 control. Remember that both are identical. Furthermore, there is an even bigger divide between Internet Explorer visitors, 27 to 16.
This unevenness is just the law of averages. It is not unreasonable to imagine this kind of unevenness. But, we expect it to go away with larger sample sizes.

You might have different conversion rates with different browsers.
Statistically, an uneven allocation leads to different results, even when all variations are equal. If the allocation of visits is so off, imagine that the allocation of visitors that are ready to convert is also allocated unevenly. This would lead to a variation in conversion rate.
And we see that in the figure above. For visitors coming with the Internet Explorer browser, none of sixteen visitors converted. Yet two converting visitors were sent to the calibration variation for a conversion rate of 7.41%.
In the case of Safari, the same number of converting visitors were allocated to the Control and the calibration variation, but only 65 visits overall were sent to the Control. Compared this to the 85 visitors sent to the Calibration Variation. It appears that the Control has a much higher conversion rate.
But it can’t because both pages are identical.
Over time, we expect most of these inconsistencies to even out. Until then they often add up to uneven results.
These forces are at work when you’re testing different pages in a AB test. Do you see why your testing tool can tell you to keep the wrong version if your sample size is too small?
Calculating Test Duration
You have to test until you’ve received a large enough sample size from different segments of your audience to determine if one variation of your web page performs better on the audience type you want to learn about. The A/A test can demonstrate the time it takes to reach statistical significance.
The duration of an AB test is a function of two factors.
- The time it takes to reach an acceptable sample size.
- The difference between the performance of the variations.
If a variation is beating the control by 50%, the test doesn’t have to run as long. The large margin of “victory”, also called “chance to beat” or “confidence”, is larger than the margin of error, even at small er sample sizes.
So, an A/A test should demonstrate a worst case scenario, in which a variation has little chance to beat the control because it is identical. In fact, the A/A test may never reach statistical significance.
In our example above, the test has not reached statistical significance, and there is very little chance that it ever will. However, we see the Calibration Variation and Control draw together after fifteen days.

These identical pages took fifteen days to come together in this A/A Test.
This tells us that we should run our tests a minimum of 15 days to ensure we have a good sample set. Regardless of the chance to beat margin, a test should never run for less than a week, and two weeks is preferable.
Setting up an A/A Test
The good thing about an A/A test is that there is no creative or development work to be done. When setting up an AB test, you program the AB testing software to change, hide or remove some part of the page. This is not necessary for an A/A test, by definition.
For an A/A test, the challenge is to choose the right page on which to run the test. Your A/A test page should have two characteristics:
- Relatively high traffic. The more traffic you get to a page, the faster you’ll see alignment between the variations.
- Visitors can buy or signup from the page. We want to calibrate our AB testing tool all the way through to the end goal.
For these reasons, we often setup A/A tests on the home page of a website.
You will also want to integrate your AB testing tool with your analytics package. It is possible for your AB testing tool to be setup wrong, yet both variations behave similarly. By pumping A/A test data into your analytics package, you can compare conversions and revenue reported by the testing tool to that reported by analytics. They should correlate.
Can I Run an A/A Test at the Same Time as an AB Test?
Statistically, you can run an A/A test on a site which is running an AB test. If the tool is working well, than your visitors wouldn’t be significantly affected by the A/A test. You will be introducing additional error to your AB test, and should expect it to take longer to reach statistical significance.
And if the A/A test does not “even out” over time, you’ll have to throw out your AB test results.
You may also have to run your AB test past statistical significance while you wait for the A/A test to run its course. You don’t want to change anything at all during the A/A test.
The Cost of Running an A/A Test
There is a cost of running an A/A test: Opportunity cost. The time and traffic you put toward an A/A test could be used to for an AB test variation. You could be learning something valuable about your visitors.
The only times you should consider running an A/A test is:
- You’ve just installed a new testing tool or changed the setup of your testing tool.
- You find a difference between the data reported by your testing tool and that reported by analytics.
Running an A/A test should be a relatively rare occurrence.
There are two kinds of A/A test:
- A “Pure” two variation test
- An AB test with a “Calibration Variation”
Here are some of the advantages and disadvantages of these kinds of A/A tests.
The Pure Two-Variation A/A Test
With this approach, you select a high-traffic page and setup a test in your AB testing tool. It will have the Control variation and a second variation with no changes.
Advantages: This test will complete in the shortest timeframe because all traffic is dedicated to the test
Disadvantages: Nothing is learned about your visitors–well, almost. See below.
The Calibration Variation A/A Test
This approach involves adding what we call a “Calibration Variation” to the design of a AB test. This test will have a Control variation, one or more “B” variations that are being tested, and another variation with no changes from the Control. When the test is complete you will have learned something from the “B” variations and will also have “calibrated” the tool with an A/A test variation.
Advantages: You can do an A/A test without stopping your AB testing program.
Disadvantages: This approach is statistically tricky. The more variations you add to a test, the larger the margin of error you would expect. It will also drain traffic from the AB test variations, requiring the test to run longer to statistical significance.

AA Test Calibration Variation in an AB Test (Optimizely)
Unfortunately, in the test above, our AB test variation, “Under ‘Package’ CTAs”, isn’t outperforming the A/A test Calibration Variation.
You Can Learn Something More From an A/A Test
One of the more powerful capabilities of AB testing tools is the ability to track a variety of visitor actions across the website. The major AB testing tools can track a number of actions that can tell you something about your visitors.
- Which steps of your registration or purchase process caused them to abandon your site
- How many visitors started to fill out a form
- Which images visitors clicked on
- Which navigation items were most frequently clicked
Go ahead and setup some of these minor actions–usually called ‘custom goals’– and then examine the behavior when the test has run its course.
In Conclusion
Hopefully, if nothing else, you were amused a little throughout this article while learning a bit more about how to ensure a successful AB test. Yes, it requires patience, which I will be the first to admit I don’t have very much of. But it doesn’t mean you have to wait a year before you switch over to your winning variation.
You can always take your winner a month or two in and use it for PPC and continue testing and tweaking on your organic traffic. That way you get the both worlds – the assurance that you’re using your best possible option on your paid traffic and taking the time to do more tests on your free traffic.
And that, my friends, is AB testing success in a nutshell. Now go find some stuff to test and tools to test with!
About the Author
- How an A/A Test Gives You Confidence - June 17, 2016
- 4 Types of Useful AB Testing Tools You May Not Realize You Have - May 20, 2016
- 9 Imaginative Approaches to AB Testing Landing Pages - April 14, 2016


Thank you for this post; I love the idea of testing the testing tool. This could also be a great exercise for anyone venturing into the world of optimization, to learn which metrics to watch for, and the value of statistical significant as related to conversion science.
You’re welcome Mindy! :)