Which SEO Landing Pages Are Making You Money?
When you’re building a blog to bring traffic to your site, it’s the organic search traffic that makes or breaks your efforts. A blog post is an SEO landing page. It draws visitors through the graces of the search engines.
SEO landing pages are challenging, primarily because it takes time to see which of them are going to work. By publishing frequently on a blog, we get a chance to try out a wide variety of SEO landing pages. Over time, we can see which drive growing SEO traffic and which don’t.
We name our SEO landing pages based on the traffic patterns they produce. Last week, I told you about Icebergs, Eagles, Burps and Fizzes. Now I’m going to show you how to quantify these.
You can get the background in my Marketing Land column Evaluating Website Performance: I’m All About That Slope.
A Flock of Eagles
Eagles don’t travel in flocks. However, when you have a bevy of eagles roosting on your website, the results are astounding.
Eagles are those blog posts which draw more and more traffic over time. Not all Eagles are created equal. Using the tools outlined in my column we can understand which of our posts is flapping along and which is using afterburners.
Following are the aggregated traffic of nine SEO landing pages that have begun to soar, or show signs of becoming an Eagle.
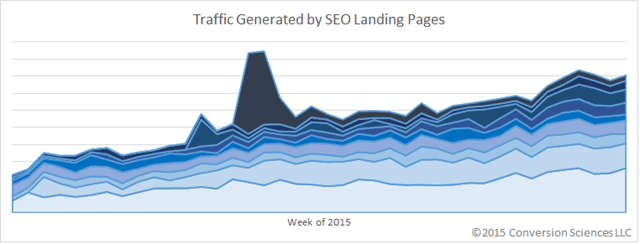
A bunch of landing pages with relatively slow individual growth can add up to some serious overall traffic.
Of our top 25 posts, 14 are Eagles and two are Dodos, or Eagles that are slow to take off. Only eight are Burps or Burp Fizzes. Not bad.
Comparing SEO Landing Pages
We analyze blog posts based on the amount of organic traffic they bring, how quickly the organic traffic is growing, and how many subscribers they generate as measured by the conversion rate. Google Analytics offers a convenient Landing Pages report that provides the raw data for our analysis.
Here are two “Eagles.” Post A took off at a strong pace, while post B has been going for longer.
Using the SLOPE, INTERCEPT, and RSQ functions of Excel, we calculate a growth rate of 3.92% for post B and 6.30% for post A. Our confidence in the fit of the trendline for Post B is 0.81 and for Post A is 0.68. We have less confidence in Post A.
Post A seems to be flattening out, but many Eagles get new life and continue climbing. Maybe Post A will one day be an iceberg. So far, Post A has generated new subscribers at a rate more than double that of Post B.
Using Data to Guide SEO Landing Page Development
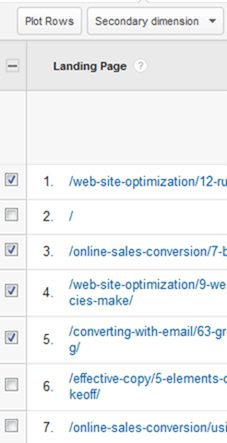
Here is a selection of SEO landing pages from The Conversion Scientist Blog and Course. I pulled this data from Google Analytics using the Behavior > Site Content > Landing Page report. We can get specific data for up to six landing pages by checking the box next to the item and clicking the Plot Rows button.
These are ranked by the conversion rate for subscribers to our conversion mini course.
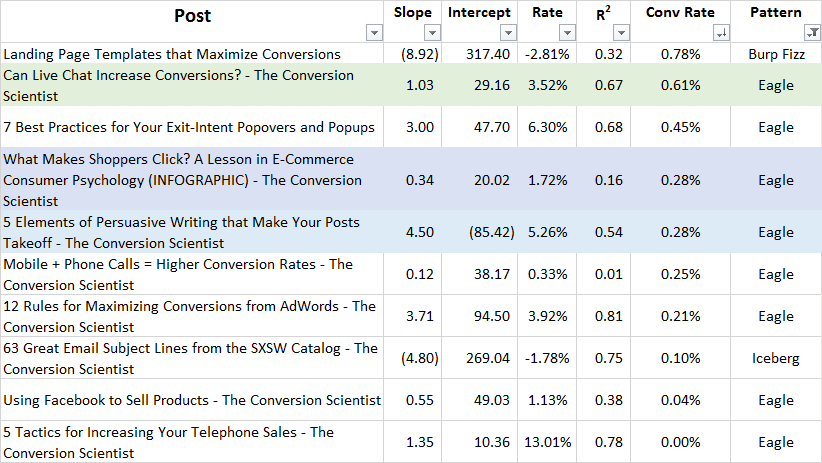
For each, I’ve calculated the key values of their trendline: Slope, y-intercept, and R-squared value. From this I can define the growth rate and organic traffic pattern.
What do we do about the Low-R-Squared posts?
The R-squared values tell us that the slope and intercept data is suspect. Do we just ignore these?
For these, and the others that don’t make sense (71.38% initial growth rate?), I recommend zooming in on the most recent trends.
Our “5 Elements of Persuasive Writing” post is young and had a pretty big coming out via email. So, we’ll focus on the most recent trend in the data.
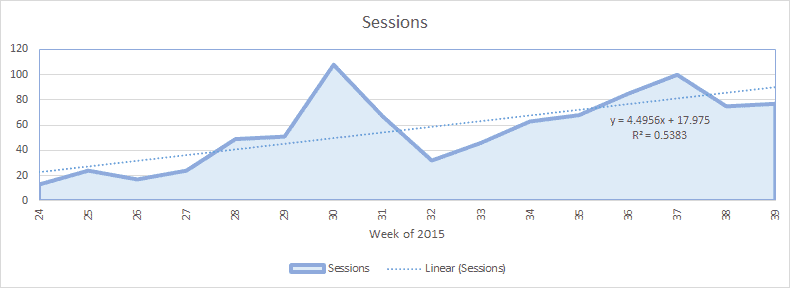
Here’s what it looks like in Excel.
You can see that we can increase our R-squared value to .54, and the rate for the more recent data is the slope (4.4956) divided by the intercept (17.975), which is 25%. So we have a .53 confidence that the orgranic traffic is growing at 25% for this post.
The infographic “What Makes Shoppers Click?” has an R-squared value of just 0.16.
However if we look at weeks 27 through 39, we get an amazing growth rate with a high R-squared value.
For this more recent period, we see a growth rate of 34% (2.967/8.76920) and an R-squared value of 0.80.
Be Careful
If you’re not careful, you can choose your data points to tell whatever story you want it to tell. Furthermore, if you’re making decisions on too few data points, you may be making the wrong decisions.
When in doubt, choose the time frame that gives you the most data points and the most conservative results.
To understand the effectiveness of your SEO landing pages, count up the number of Eagles you have as compared to those that aren’t growing. Use the landing page report in Google Analytics to find out which are resulting in the most conversions. Then calculate the slope and y-intercept to understand the future potential of these pages.
For additional reading, check out this piece on landing page best practices for optimal conversion.








Thanks for sharing such amazing Information. SEO is very important for any website in order to obtain organic traffic. Using adsense we can make good amount of money with organic traffic. Great job for publishing a beneficial article..
Thanks for the kind words.