Use Google Analytics to Measure the Impact of Video on Your Bottom Line
Brian Massey, the Conversion Scientist™, shares how to combine data from video hosting services with Google Analytics to measure video impact on your revenue and conversions.
In this episode of The Conversion Scientist Podcast, Brian Massey tells you how to gain insights from third-party tools in Google Analytics. He uses several video hosts as an example to show step by step how to integrate these “In-App” video metrics with Analytics. And how to use Google Analytics to measure the impact of video content on your revenue.
Remember to check the very last section of this article to watch the free eight-part bit-sized video mini-course, “Video that Converts”
When “In-App” Analytics Are Not Enough to Gauge Impact on Conversions and Revenue
We were working on a client that sells a software application. After completing a test, we identified a single change that could increase the number of demo requests by 29%.
What was the change that would cause such a dramatic lift in conversion rate?
We removed a video from their demo request page.
Why? A quick look at the analytics showed that only few visitors were watching the video. We had a hunch that it was probably a barrier to conversions. And it was blocking more important information — information that could persuade more visitors to fill out the form on the page.
Video is just one of the many third-party services commonly implemented on ecommerce websites. Others include exit-intent overlays, live chat, ratings and reviews, faceted search or personalized and predictive product recommendations services.
The vast majority of third-party services will offer “in-app” analytics to help you assess their impact on your visitors’ behavior. Even though these “In App” analytics can provide insight into your online customers, they cannot show you the tools’ impact on leads and sales.
Integration with primary analytics tools, such as Google Analytics, is a must when identifying opportunities to optimize.
Using Google Analytics to Measure the Impact of Video on Revenue
Now, let’s take a deeper look at how integration of third-party analytics with Google Analytics can help answer difficult questions about our video ROI.
In-App Analytics
The vast majority of third-party tools offer useful analytics.
Let’s consider video hosts first. These services host your marketing videos and allow you to embed them on your site, landing pages and/or social media channels. Their promise is simple: faster, more reliable streaming than your basic website servers. Plus in-app video analytics.
We have used a variety of these providers in our video conversion projects, such as YouTube, Vimeo, Ooyala, Wistia and Vidyard. While YouTube is free, it gives your visitors too many opportunities to leave the webpage. The rest require a monthly video hosting fee.
All of these services offer some kind of dashboard with basic in-app analytics. Some of the metrics they share are:
- Number of times a video is loaded
- Number of times a video is played
- Percentage of visitors who clicked Play
- Average percentage of video watched
- Geo distribution of your video audience
A Wistia Analytics Example
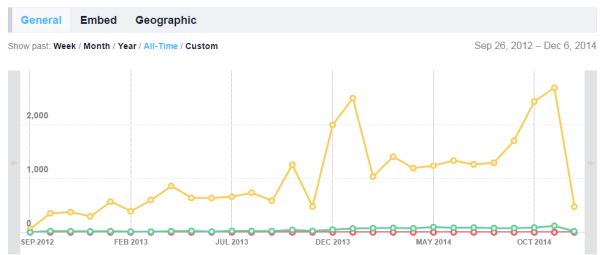
We can see on the Vimeo graph below, the load counts, play counts and social sharing counts for this particular video.
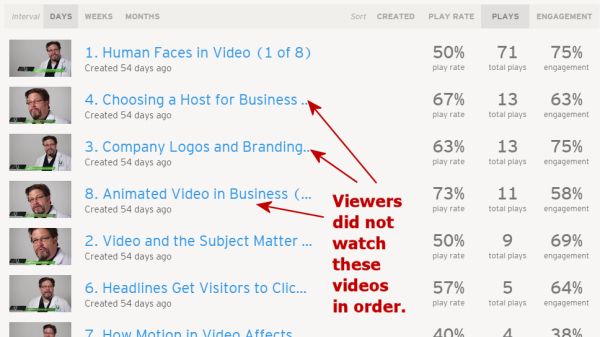
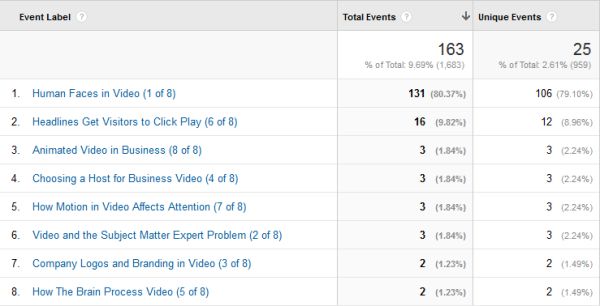
More interestingly, the Wistia report below, on an eight-part video series shows that viewers did not watch them in order. And we can deduce which of the topics captured our visitor’s interest.
Audience Retention Analysis: Vidyard and YouTube Examples
If you are interested in finding which part of a video is less interesting to your video viewers, Vidyard and YouTube have a viewer drop-off graph. You may use it to gather how many stick around until the end.
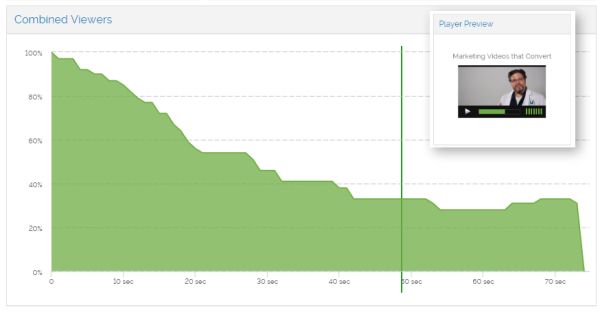
In this Vidyard chart we can see that almost half of my viewers dropped off within 20 seconds. This video needs a stronger intro.
The results can be quite informative.
Consider this audience retention graph from a YouTube account. See the pronounced viewer drop-off in the first few seconds? Something made more than 10% of video viewers leave within seconds of starting the video. What could it be?
This audience retention visual report can be found inside your YouTube channel, synced with the video you are analyzing.
Our hypothesis was that viewers lost interest due to a vanity logo sequence. And it was costing us viewers.
We picked another video without vanity intro and we noticed a much smaller initial drop-off at the beginning. This supported our hypothesis.

The YouTube chart for the video without a vanity intro shows a slight engagement lift at the very beginning.
Vanity, thy name is logo. Even we at Conversion Sciences have given in to our egos with similarly unpleasant results.
It goes without saying that we no longer use the cool branding sequence in our marketing videos.
Measuring the Impact of Video on your Bottom Line: Integrated Analytics
The biggest barrier in-app analytics have is that they cannot be linked to our revenue metrics, namely leads and sales.
Predictive metrics like Engagement or Attention are not definitive. They can only suggest what might happen.
And as we have said again and again, increasing engagement may actually decrease conversion.
These are the questions we need answered by our analytics:
- Do those customers who view the video buy more often?
- Are they more likely to complete a lead form?
- Are they buying more or less?
- Does their buying behavior change if they only watch part of a video? If so, how?
- Which videos generate more sales than others?
Time to bring in this third-party vendor data and integrated with Google Analytics.
The good news is, most of these third-party platforms or applications provide a way to generate Google Analytics events on visitor interaction. Events like watching a video, performing a filtered search or starting a live chat.
Integrating Google Analytics could be as simple as entering your Google Analytics ID, enabling a Google Tag Manager pre-written tag or adding some Javascript tracking code to your page.
Integrate Google Analytics to Measure the Impact of Video on Conversions
Video platforms generally fire Events when somebody plays the video, for the duration of the play and when the video has been watched to completion. Therefore, we don’t have much control over the type of Events the video platform provides.
Nevertheless, this is usually enough for us to create some advanced segments and assess the impact of the video on our sales or lead conversions.
We tested both Wistia and Vidyard in-app analytics integrated with Google Analytics on our eight-part video mini-course.
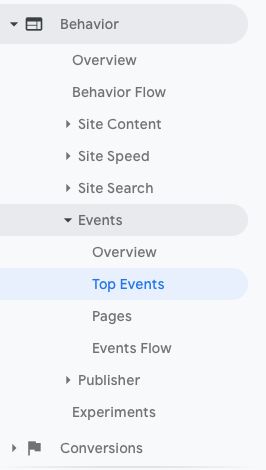
To see the Events generated by either of the embedded video players, choose Behavior > Events in Google Analytics.
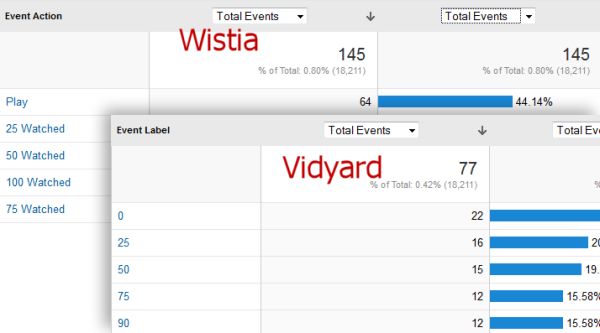
Here you will be able to see which Events are being generated by either of the video platforms. In this case, both send us Events when a video was played and for how long.
Now, switch from Event Action to Event Label as the Primary Dimension on your Google Analytics report to see which videos are being watched.
But all of the above data can be found within the respective tools’ dashboards. Let’s dive into more interesting information by creating Advanced Segments.
Creating a GA Advanced Segment with Wistia’s Events
To measure and isolate sessions in which the visitor played a video, we built an Advanced Segment in Google Analytics. This is particularly useful for online shops. It allows us to find out the impact of these videos on customer’s purchasing habits.
We used Wistia’s Play Event to isolate those sessions in which any of the eight videos in our series was viewed.
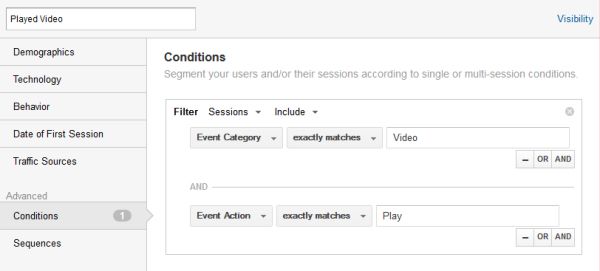
By creating an Advanced Segment in Google Analytics, we can look at sessions that include visitors who watched a video.
Our Wistia’s Played Video Advanced Segment includes sessions where a visitor played a video.
Use this segment to filter your ecommerce site Revenue, Conversion and Transaction data. Identify those visitors who watched one or more videos. Now, discover if this affected their buying behavior.

Comparing a buyer who interacted with a video to the “average” site visitor, we observe a drop in conversion rate and average order value.
In this example, the report strongly implies that website buyers who watched the video were less likely to make a purchase and bought less.
A simple integration of you video platform’s data with Google Analytics can derive stronger insights to find out the true impact of video on your bottom-line. Which ones will you find in your analytics now? Is your third-party app helping or hindering your sales or leads?
For more on Google Analytics to Measure the Impact of Video on Your Revenue, Listen to the Podcast
In this episode of The Conversion Scientist Podcast, Brian Massey tells you how to gain insights from third-party tools in Google Analytics. He uses several video hosts as an example.
Link to Article on Marketing Land
Watch the free eight-part bit-sized video mini-course
Since you are a student of our Conversion Course, you get the entire mini-course Video that Converts.
An important eight-part series on creating marketing videos that convert visitors to leads and sales from Conversion Sciences.
- How Faces Influence Video Marketing
- Using Video to Solve the Subject Matter Expert Problem
- How Marketing Videos Chase Viewers Away in the First Seconds
- Video Hosting-Why Youtube is the Wrong Choice
- How the Brain Processes Video
- Headlines that Get Visitors to Click Play
- How Motion in Marketing Videos Affects Viewer Attention
- Video Marketing Using Animation
Special thanks to Vidpow for producing the videos in our Video that Converts Mini-course.

