10 CRO Experts Explain How To Profitably Analyze AB Test Results
The AB test results had come in, and the result was inconclusive. The Conversion Sciences team was disappointed. They thought the change would increase revenue. What they didn’t know what that the top-level results were lying.
While we can learn something from inconclusive tests, it’s the winners that we love. Winners increase revenue, and that feels good.
The team looked closer at our results. When a test concludes, we analyze the results in analytics to see if there is any more we can learn. We call this post-test analysis.
Isolating the segment of traffic that saw test variation A, it was clear that one browser had under-performed the others: Internet Explorer.

Performance of Variation A. Internet Explorer visitors significantly under-performed the other three popular browsers.
The visitors coming on Internet Explorer were converting at less than half the average of the other browsers and generating one-third the revenue per session. This was not true of the Control. Something was wrong with this test variation. Despite a vigorous QA effort that included all popular browsers, an error had been introduced into the test code.
Analysis showed that correcting this would deliver a 13% increase in conversion rate and 19% increase in per session value. And we would have a winning test after all.
Conversion Sciences has a rigorous QA process to ensure that errors like this are very rare, but they happen. And they may be happening to you.
Post-test analysis keeps us from making bad decisions when the unexpected rears its ugly head. Here’s a primer on how conversion experts ensure they are making the right decisions by doing post-test analysis.
Did Any Of Our Test Variations Win?
The first question that will be on our lips is, “Did any of our variations win?”
There are two possible outcomes when we examine the results of an AB test.
- The test was inconclusive. None of the alternatives beat the control. The null hypotheses was not disproven.
- One or more of the treatments beat the control in a statistically significant way.
Joel Harvey of Conversion Sciences describes his process below:
Chris McCormick, Head of Optimisation at PRWD, describes his process:
Are We Making Type I or Type II errors?
In our post on AB testing statistics, we discussed type I and type II errors. We work to avoid these errors at all cost.
To avoid errors in judgement, we verify the results of our testing tool against our analytics. It is very important that our testing tool send data to our analytics package telling us which variations are seen by which segments of visitors.
Our testing tools only deliver top-level results, and we’ve seen that technical errors happen. So we can reproduce the results of our AB test using analytics data.
Did each variation get the same number of conversions? Was revenue reported accurately?
Errors are best avoided by ensuring the sample size is large enough and utilizing a proper AB testing framework. Peep Laja describes his process below:
How Did Key Segments Perform?
In the case of an inconclusive test, we want to look at individual segments of traffic.
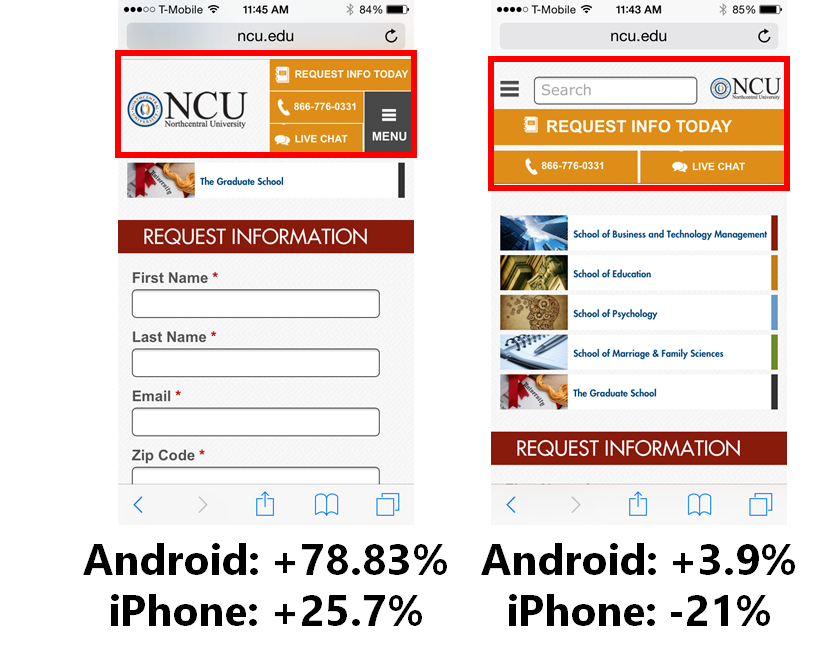
For example, we have had an inconclusive test on smartphone traffic in which the Android visitors loved our variation, but iOS visitors hated it. They cancelled each other out. Yet we would have missed an important piece of information had we not looked more closely.

Visitors react differently depending on their device, browser and operating system.
Other segments that may perform differently may include:
- Return visitors vs. New visitors
- Chrome browsers vs. Safari browsers vs. Internet Explorer vs. …
- Organic traffic vs. paid traffic vs. referral traffic
- Email traffic vs. social media traffic
- Buyers of premium products vs. non-premium buyers
- Home page visitors vs. internal entrants
These segments will be different for each business, but provide insights that spawn new hypotheses, or even provide ways to personalize the experience.
Understanding how different segments are behaving is fundamental to good testing analysis, but it’s also important to keep the main thing the main thing, as Rich Page explains:
Nick So of WiderFunnel talks about segments as well within his own process for AB test analysis:
In addition to understanding how tested changes impacted each segment, it’s also useful to understand where in the customer journey those changes had the greatest impact, as Benjamin Cozon describes:
Finally, while it is a great idea to have a rigorous quality assurance (QA) process for your tests, some may slip through the cracks. When you examine segments of your traffic, you may find one segment that performed very poorly. This may be a sign that the experience they saw was broken.
It is not unusual to see visitors using Internet Explorer crash and burn since developers abhor making customizations for that non-compliant browser.
How Did Changes Affect Lead Quality?
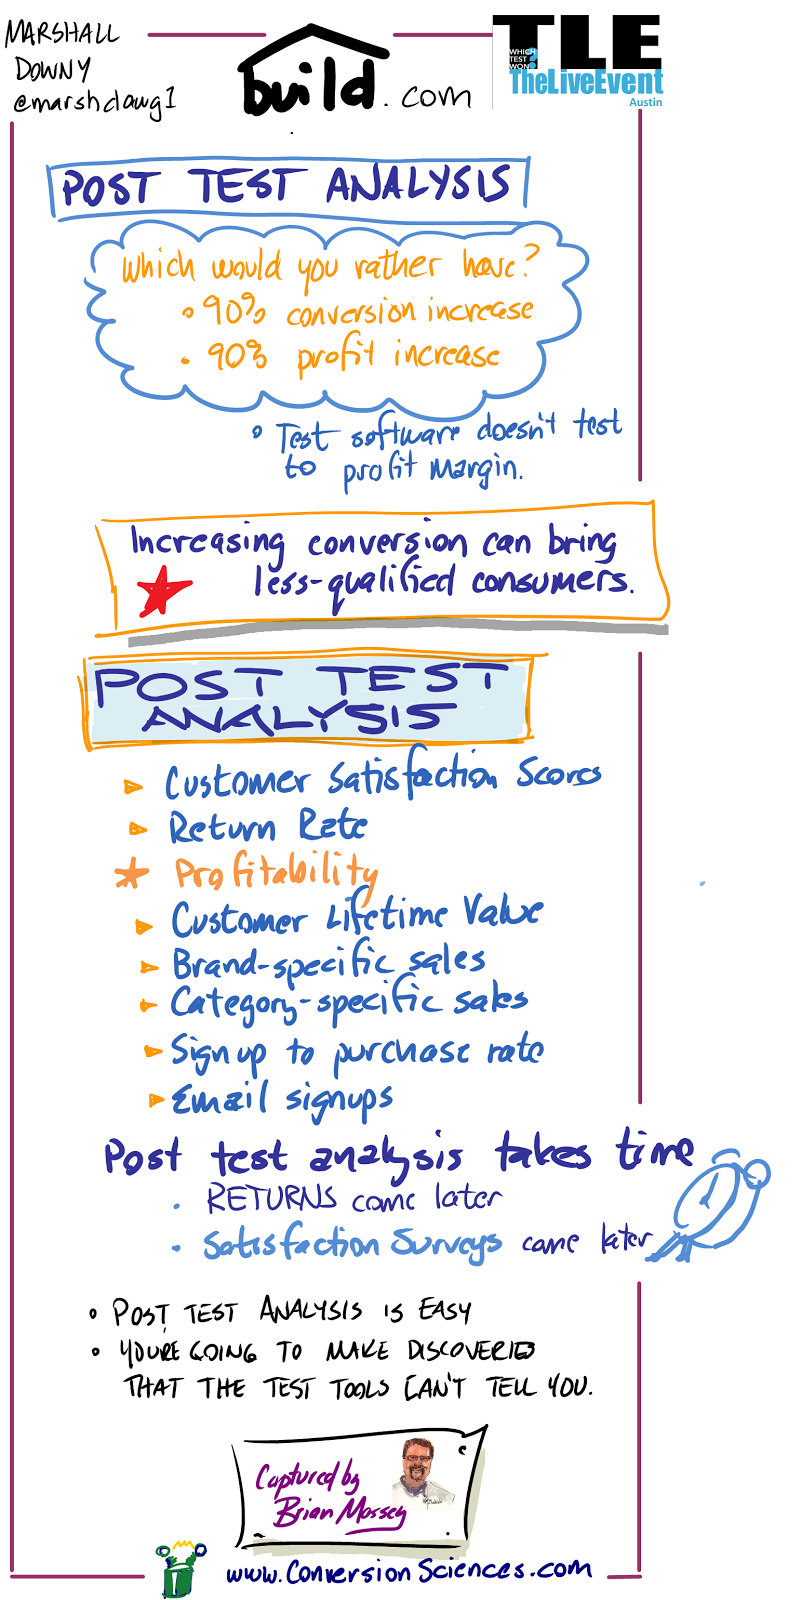
Post test analysis allows us to be sure that the quality of our conversions is high. It’s easy to increase conversions. But are these new conversions buying as much as the ones who saw the control?
Several of Conversion Sciences’ clients prizes phone calls and the company optimizes for them. Each week, the calls are examined to ensure the callers are qualified to buy and truly interested in a solution.
In post-test analysis, we can examine the average order value for each variation to see if buyers were buying as much as before.
We can look at the profit margins generated for the products purchased. If revenue per visit rose, did profit follow suit?
Marshall Downey of Build.com has some more ideas for us in the following instagraph infographic.
Revenue is often looked to as the pre-eminent judge of lead quality, but doing so comes with it’s own pitfalls, as Ben Jesson describes in his approach to AB test analysis.
Analyze AB Test Results by Time and Geography
Conversion quality is important, and Theresa Baiocco takes this one step further.
Look for Unexpected Effects
Results aren’t derived in a vacuum. Any change will create ripple effects throughout a website, and some of these effects are easy to miss.
Craig Andrews gives us insight into this phenomenon via a recent discovery he made with a new client:
Testing results can also be compared against an archive of past results, as Shanelle Mullin discusses here:
Why Did We Get The Result We Got?
Ultimately, we want to answer the question, “Why?” Why did one variation win and what does it tell us about our visitors?
This is a collaborative process and speculative in nature. Asking why has two primary effects:
- It develops new hypotheses for testing
- It causes us to rearrange the hypothesis list based on new information
Our goal is to learn as we test, and asking “Why?” is the best way to cement our learnings.

 Joel Harvey,
  Chris McCormick,
  Peep Laja,
  Rich Page,
  Nick So,
  Benjamin Cozon,
 Ben Jesson,
  Theresa Baiocco,


 Craig Andrews,
  There are two benefits to archiving your old test results properly. The first is that you’ll have a clear performance trail, which is important for communicating with clients and stakeholders. The second is that you can use past learnings to develop better test ideas in the future and, essentially, foster evolutionary learning.


Trackbacks & Pingbacks
[…] Here’s how Chris McCormick from PRWD explains the process: […]
[…] Here’s how Chris McCormick from PRWD explains the process: […]
[…] Here’s how Chris McCormick from PRWD explains the process: […]
[…] Here’s how Chris McCormick from PRWD explains the process: […]
[…] For a more in-depth look at post test analysis, including insights from the CRO industry’s foremost experts, click here: 10 CRO Experts Explain How To Profitably Analyze AB Test Results […]
Comments are closed.