The 6 Rules of Behavioral Data Built Into All of Us
We all make decisions every day based on what other people are doing. You are wired to navigate the world using behavioral data.
When you check Facebook to see how many people like and comment on your most recent post, you’re using your built-in behavioral know-how. When you select a movie based on the Rotten Tomatoes Freshness Score, you are getting your behavioral science on. The New York Times Best Seller list, the Billboard Charts, and the laugh track on The Big Bang Theory are all sources of behavioral data that we use to make decisions every day.
If you don’t believe me, let’s use an example. When my son was 14, he built his own gaming computer. He had meticulously researched every component, from the high-frequency monitor to the mouse pad. His last decision was the motherboard, the foundation of the computer that every element plugs into.
He had narrowed it down to two alternatives. They had the same features and were priced within pennies of each other. Reviewers of the motherboards had given one a four-star rating, and the other a five-star rating.
If we didn’t understand the first rule of behavioral data, we would have simply chosen the five-star motherboard. Five stars is better than four, right? But even at the tender age of 14, Sean was smart enough to see how many reviews had fed those ratings.
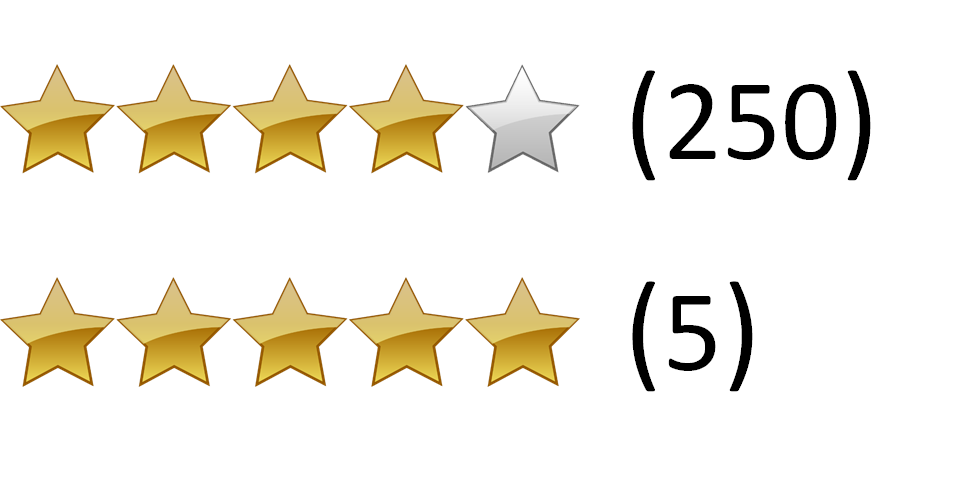
Two products with similar features and price. You know which rating to believe.
The five-star motherboard had five reviews, while the lower-rated four-star motherboard had 250 reviews. You have no doubt about which rating is most reliable. Your little brain, like my son’s, is doing the math. We know that the five-star rating is just as likely to be a three- or two-star rating.
The data isn’t in.
You are intuitively calculating what statisticians call n: The Sample Size of the data collected (the reviews). And you know the first rule of behavioral data.
1. Larger Sample Sizes Are Better Than Smaller Sample Sizes
It is rarely feasible to ask every single person who would buy from us what it would take to get them to give us money. Instead, we ask a sample of our audience what they think. If our sample is big enough, we can assume that our entire audience will feel the same way.
The larger the sample size we can generate–little n–the more accurately we can predict how our campaigns and websites will perform.
This is why a “launch and see” approach is so appealing. We feel that we need to launch something to reach a large sample size of potential buyers. Or, we decide to rely on experts to make good decisions about what we should create to sell our businesses.
Campaign development often starts with a creative director. In this case, n=1. If this person gets input from their team, we are getting insights from a handful of people. Our sample size might be five or ten. If we run a focus group or survey, we can get the input from a dozen people or more. Little n might be as high as 20.
These sample sizes are not enough to predict the future statistically. You can see why advertising and web sites designed by small teams can fail. The number of people involved in the research is small.
When we collect online analytics, we are involving hundreds or thousands of people in our development process. Little n is much, much larger. As we all know intuitively, this means the data is more reliable, like the number of reviews of our motherboards.
We are also calculating another statistical value when we look at these ratings and reviews: the total population, or N.
2. Data Over Time Is Better Than Data At One Point In Time
When we consider our two motherboards, and look at the sample sizes, we will naturally infer how many of each had been sold. The 5-star product only has five reviews. Either it had not been on the market long, or it just wasn’t selling well. As a result, we will assume that the population of buyers–N–is small, and that the time over which these reviews were collected was small.
We know intuitively that data collected over a long time is better than data collected over a short time. Things change over time. Even within a week, people buy more or less on weekdays than an weekends.
When we run a focus group, launch a survey, do a marketing study, we’re measuring our audience at one point in time. If you survey swimmers about their preferences for beachwear in January, you might get very different results than if you asked them in July.
When data is cheap, we can measure it year round, all the time. Behavioral data can be collected constantly on our digital properties. With just a few lines of code on your website, your analytics software builds a very helpful behavioral database day and night. Once you have this database, you can decide what part of the year you want to examine. Or use the entire year.
Our friends at Decorview sell high-end window treatments from companies like Hunter Douglas. One might assume that the people that buy luxury household items like this would not be too price sensitive. We found some data that told us the opposite.
When we examined the search ads that Decorview had run, we found that ads featuring discounts were far and away the most clicked. These ad campaigns had been running for months and years, so we tended to trust the data.

Ads featuring discounts generated more clicks for high-end window treatments.
We changed the landing page to feature discounts and saw a 40% increase in leads from an AB test.

Advertising data collected over time helped us create a high-converting landing page.
3. More-Recent Data Is Better Than Less-Recent Data
If, in fact, things and people change over time, then we would tend to trust more recent data vs. old data. This is also way we may retest something we already collected data on last year.
Traditionally, market research has takes time and effort. Most marketing studies were months old before they are applied to a campaign. As the time and cost of research has dropped, we perform studies more often and with more precision.
There is little good reason to use stale data when it is so easy to collect it fresh from the farm.
The personalized childrens book The Little Boy Who Lost His Name had sold a half-million copies, and the publisher had high hopes for the next installment, The Incredible Galactic Journey Home.

The Little Boy Who Lost His Name had sold over 500,000 copies. Source: UsabilityHub.com
Unfortunately, the Incredible Intergalactic Journey didn’t sell nearly as well. The past had not repeated.
Some alternative covers were developed and data collected through UsabilityHub.

Source: UsabilityHub.com
The newly designed cover immediately improved sales. Things had changed since the first book came out, and fresh data was needed.
4. Observational Data Is Better Than Self-Reported Data
When we ask a survey panel or focus group what they think of our creative, they will lie. Humans are very good at rationalizing their decisions, but few know the real psychological reasons why they act the way they do.
Behavioral input, on the other hand, is an observation of people as they act. We don’t necessarily have to ask them why they do something. We can watch.
The classic manifestation of this is the derided popup window. Universally despised by everyone you ask, these little windows will reliably increase leads and subscribers in almost every situation, especially exit-intent popovers. The self-reported data clearly doesn’t support the observational data.
5. Customers & Prospects Are More Believable Than Pretenders
Yelp has come under fire in recent years because of fake reviews. Businesses were hiring people to write glowing reviews about them. It turns out that advertisers want to take advantage of your natural behavioral science abilities to trick you with bad data.
When we see a brand with tens of thousands of likes on Facebook, we take it with a grain of salt. It’s easy to like something. That doesn’t mean these likes came from customers.
When launching surveys, taste tests and focus groups, we want to get subjects that are as much like our customers as possible, but ultimately, it is unlikely they are searching for our product at the time we are asking them their opinion.
This is why keyword advertising is better than display ads. We’re speaking to people who are more likely looking for what we offer.
Behavioral data, by definition, is gathered from the activities of prospects and customers as they interact with our digital properties, our products and our services. They wouldn’t be there otherwise. We can trust that the larger population of prospects will behave similarly.
6. Quantitative Data Is More Reliable Than Qualitative Data
When you look at the star rating for a product and the number of reviews, you are using quantitative data to guide your decision.
When you read the reviews, you are using qualitative data.
Both can be helpful, but only one will predict the future reliably.
Qualitative collection methods allow us to drill down with a few subjects to understand more about their emotions and motivations. We don’t know if these emotions and motivations are representative of the broader market.
Quantitative data gives us more statistical confidence that what we are seeing represents the larger market. However, this data isn’t seasoned with human input. Both are important.
The two can be used hand-in-hand. It’s the quantitative data that ultimately wins the day.
The company Automatic sells a device that plug into most modern cars and connects a car’s computer to your phone. This connection gives drivers the data they need to maintain their automobiles and become better drivers. Automatic launched a “Pro” version of their product that didn’t require your phone to connect to the internet. It had its own 3G connection.
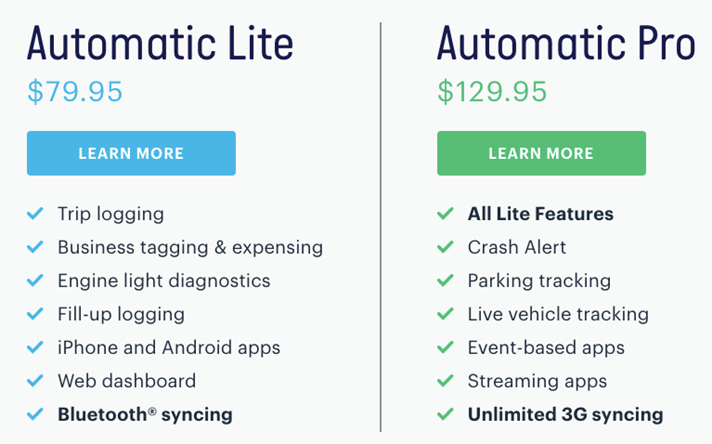
The feature comparison chart that caused more buyers to choose Automatic Lite.
Yet, most people were buying the Lite version. We wanted to find out why.
We asked buyers why they chose the Lite version in a popup survey on the receipt page. We got a lot of feedback, but this comment summed it up best:
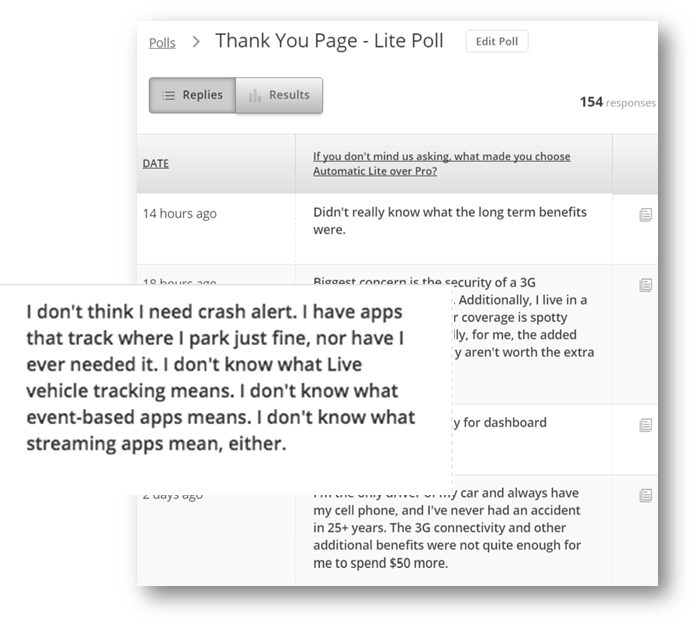
A thank-you page survey asked, “What made you choose Automatic Lite over Pro?”
We didn’t stop with this input. We removed the confusing features from the feature list, and designed an AB test to collect some observational data.
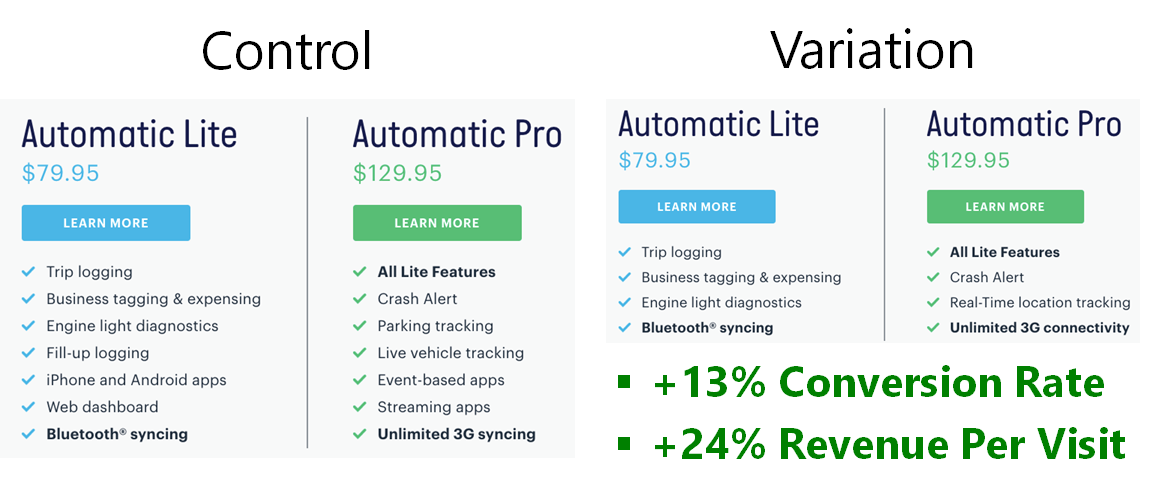
Our AB test tested a shorter feature list, eliminating confusing features.
In an AB test, the visitors don’t even realize that they are being tested. We are simply observing the results of their interactions. In this case, our changes increased conversion rates, and increased sales of the Pro unit as a percentage of overall sales.
Final Thoughts
There has been a lot of focus on AB testing as a marketing tool in recent years. This is because AB tests are designed to follow all of the rules of behavioral data. They are designed to deliver observational, recent data, taken over time from a statistically significant sample of prospects that can be quantitatively analyzed.
As a marketer, you can tap into this innate scientific know-how, using it to predict the performance of your campaigns and make them better.





Excellent article. I’m going to save it and re-read it in a few days. You have a typo in the paragraph after the star graphic: “The four-star motherboard had five reviews” — you mean the five-star.
Thanks for pointing out the typo. It is fixed. And thanks for the kind words.
Very informative and appreciated Brian. Also saving to re-read & have as a resource. Thanks!
Thanks, Dennis. Please share!
Very informative and appreciated Brian. Thanks!