A fundamental concept in A/B testing is statistical hypothesis testing. It involves creating a hypothesis about the relationship between two data sets and then comparing these data sets to determine if there is a statistically significant difference. It may sound complicated, but it explains how A/B testing works.
In this article, we’ll take a high-level look at how statistical hypothesis testing works, so you understand the science behind A/B testing. If you prefer to get straight to testing, we recommend our turnkey conversion optimization services.
Null and Alternative Hypotheses
In A/B testing, you typically start with two types of hypotheses:
First, a Null Hypothesis (H0). This hypothesis assumes that there is no significant difference between the two variations. For example, “Page Variation A and Page Variation B have the same conversion rate.”
Second, an Alternative Hypothesis (H1). This hypothesis assumes there is a significant difference between the two variations. For example, “Page Variation B has a higher conversion rate than Page Variation A.”
Additional reading: How to Create Testing Hypotheses that Drive Real Profits
Disproving the Hypothesis
The primary goal of A/B testing is not to prove the alternative hypothesis but to gather enough evidence to reject the null hypothesis. Here’s how it works in practical terms:
Step 1: We formulate a hypothesis predicting that one version (e.g., Page Variation B) will perform better than another (e.g., Page Variation A).
Step 2: We collect data. By randomly assigning visitors to either the control (original page) or the treatment (modified page), we can collect data on their interactions with the website.
Step 3: We analyze the results, comparing the performance of both versions to see if there is a statistically significant difference.
Step 4: If the data shows a significant difference, you can reject the null hypothesis and conclude that the alternative hypothesis is likely true. If there is no significant difference in conversion rates, you assume the null hypothesis is true and reject the alternative hypothesis.
Example
To illustrate this process, consider an example where you want to test whether changing the call-to-action (CTA) button from “Purchase” to “Buy Now” will increase the conversion rate.
- Null Hypothesis: The conversion rates for “Purchase” and “Buy Now” are the same.
- Alternative Hypothesis: The “Buy Now” CTA button will have a higher conversion rate than the “Purchase” button.
- Test and Analyze: Run the A/B test, collecting data on the conversion rates for both versions.
- Conclusion: If the data shows a statistically significant increase in conversions for the “Buy Now” button, you can reject the null hypothesis and conclude that the “Buy Now” button is more effective.
Importance of Statistical Significance in A/B Testing
Statistical significance tells you whether the results of a test are real or just random.
When you run an A/B test, for example, and Version B gets more conversions than Version A, statistical significance tells you whether that difference is big enough (and consistent enough) that it likely didn’t happen by chance.
It’s the difference between saying:
“This headline seems to work better…”
vs.
“We’re 95% confident this headline works better—and it’s worth making the change.”
In simple terms:
✅ If your test reaches statistical significance, you can trust the results.
❌ If it doesn’t, the outcome might just be noise—and not worth acting on yet.
We achieve statistical significance by ensuring our sample size is large enough to account for chance and randomness in the results.
Imagine flipping a coin 50 times. While probability suggests you’ll get 25 heads and 25 tails, the actual outcome might skew because of random variation. In A/B testing, the same principle applies. One version might accidentally get more primed buyers, or a subset of visitors might have a bias against an image.
To reduce the impact of these chance variables, you need a large enough sample. Once your results reach statistical significance, you can trust that what you’re seeing is a real pattern—not just noise.
That’s why it’s crucial not to conclude an A/B test until you have reached statistically significant results. You can use tools to check if your sample sizes are sufficient. By making these refinements, the text becomes more concise, clear, and easier to follow.

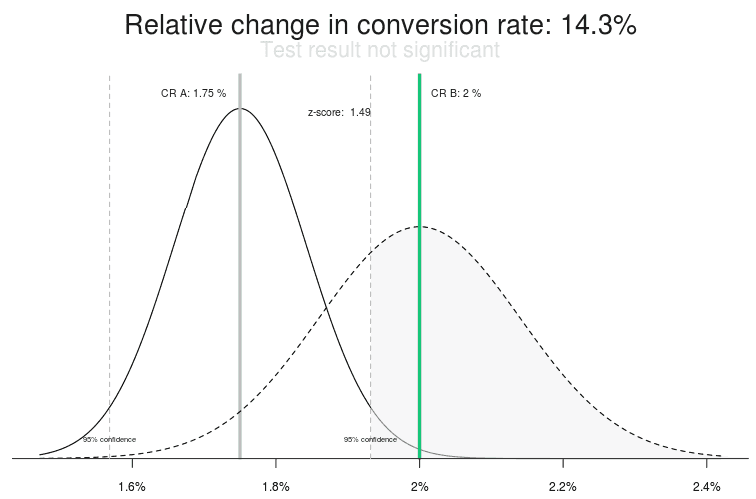
While it appears that one version is doing better than the other, the results overlap too much.
Additional Reading: Four Things You Can Do With an Inconclusive A/B Test
How Much Traffic Do You Need to Reach Statistical Significance?
The amount of traffic you need depends on several factors, but most A/B tests require at least 1,000–2,000 conversions per variation to reach reliable statistical significance. That could mean tens of thousands of visitors, especially if your conversion rate is low.
Here’s what affects your sample size requirement:
- Baseline conversion rate – The lower it is, the more traffic you’ll need.
- Minimum detectable effect (MDE) – The smaller the lift you want to detect (e.g., a 2% increase), the more traffic is needed.
- Confidence level – Most tests aim for 95% statistical confidence.
- Statistical power – A standard power level is 80%, which ensures a low chance of false negatives.
Rule of thumb: If your site doesn’t get at least 1,000 conversions per month, you may struggle to run statistically sound tests—unless you’re testing big changes that could yield large effect sizes.
How A/B Testing Tools Work
The tools that make A/B testing possible provide an incredible amount of power. If we wanted, we could use these tools to make your website different for every visitor to your website. The reason we can do this is that these tools change your site in the visitors’ browsers.
When these tools are installed on your website, they send some code, called JavaScript, along with the HTML that defines a page. As the page is rendered, this JavaScript changes it. It can do almost anything:
- Change the headlines and text on the page.
- Hide images or copy.
- Move elements above the fold.
- Change the site navigation.
When testing a page, we create an alternative variation of the page with one or more elements changed for testing purposes. In an A/B test, we limit the test to one element so we can easily understand the impact of that change on conversion rates. The testing tool then does the heavy lifting for us, segmenting the traffic and serving the control (or existing page) or the test variation.
It’s also possible to test more than one element at a time—a process called multivariate testing. However, this approach is more complex and requires rigorous planning and analysis. If you’re considering a multivariate test, we recommend letting a Conversion Scientist™ design and run it to ensure valid, reliable results.
Primary Functions of A/B Testing Tools
A/B testing software has the following primary functions.
Serve Different Webpages to Visitors
The first job of A/B testing tools is to show different webpages to certain visitors. The person who designed your test will determine what gets shown.
An A/B test will have a “control,” or the current page, and at least one “treatment,” or the page with some change. The design and development team will work together to create a different treatment. JavaScript must be written to transform the control into the treatment.
It is important that the JavaScript works on all devices and in all browsers used by the visitors to a site. This requires a committed QA effort. At Conversion Sciences, we maintain a library of devices of varying ages that allows us to test our JavaScript for all visitors.
Split Traffic Evenly
Once we have JavaScript to display one or more treatments, our A/B testing software must determine which visitors see the control and which see the treatments.
Typically, every other user will get a different page. Visitors are distributed evenly across variations—control, then treatment A, then B, then back to control, and so on—ensuring balanced traffic. Around it goes until enough visitors have been tested to achieve statistical significance.
It is important that the number of visitors seeing each version is about the same size. The software tries to enforce this.
Measure Results
The A/B testing software tracks results by monitoring goals. Goals can be any of a number of measurable things:
- Products bought by each visitor and the amount paid
- Subscriptions and signups completed by visitors
- Forms completed by visitors
- Documents downloaded by visitors
While nearly anything can be measured, it’s the business-building metrics—purchases, leads, signups—that matter most.
The software remembers which test page was seen. It calculates the amount of revenue generated by those who saw the control, by those who saw treatment one, and so on.
At the end of the test, we can answer one very important question: which page generated the most revenue, subscriptions or leads? If one of the treatments wins, it becomes the new control.
And the process starts over.
Do Statistical Analysis
The tools are always calculating the confidence that a result will predict the future. We don’t trust any test that doesn’t have at least a 95% confidence level. This means that we are 95% confident that a new change will generate more revenue, subscriptions or leads.
Sometimes it’s hard to wait for statistical significance, but it’s important lest we make the wrong decision and start reducing the website’s conversion rate.
Report Results
Finally, the software communicates results to us. These come as graphs and statistics that not only show results, they help you decide what to implement—and what to test next.

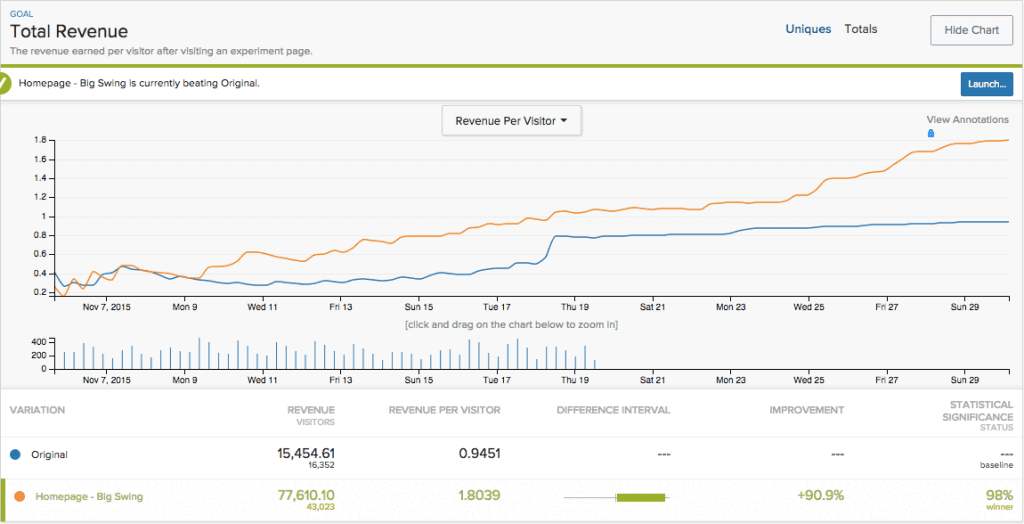
AB Testing Tools deliver data in the form of graphs and statistics.
It’s easy to see that the treatment won this test, giving us an estimated 90.9% lift in revenue per visitor with a 98% confidence.
This is a large win for this client.
Curious about the wins you’d see with a Conversion Scientist™ managing your CRO program? Book a free strategy call today.
Selecting The Right Tools
Of course, there are a lot of A/B testing tools out there, with new versions hitting the market every year. While there are certainly some industry favorites, the tools you select should come down to what your specific businesses requires.
In order to help make the selection process easier, we reached out to our network of CRO specialists and put together a list of the top-rated tools in the industry. We rely on these tools to perform for multi-million dollar clients and campaigns, and we are confident they will perform for you as well.
Check out the full list of tools here: The 20 Most Recommended A/B Testing Tools By Leading CRO Experts


