The AB test results had come in, and the result was inconclusive. The Conversion Sciences team was disappointed. They thought the change would increase revenue. What they didn’t know what that the top-level results were lying.

While we can learn something from inconclusive tests, it’s the winners that we love. Winners increase revenue, and that feels good.

The team looked closer at our results. When a test concludes, we analyze the results in analytics to see if there is any more we can learn. We call this post-test analysis.

Isolating the segment of traffic that saw test variation A, it was clear that one browser had under-performed the others: Internet Explorer.

Performance of Variation A. Internet Explorer visitors significantly underperformed the other three popular browsers.

Performance of Variation A. Internet Explorer visitors significantly under-performed the other three popular browsers.

The visitors coming on Internet Explorer were converting at less than half the average of the other browsers and generating one-third the revenue per session. This was not true of the Control. Something was wrong with this test variation. Despite a vigorous QA effort that included all popular browsers, an error had been introduced into the test code.

Analysis showed that correcting this would deliver a 13% increase in conversion rate and 19% increase in per session value. And we would have a winning test after all.

Conversion Sciences has a rigorous QA process to ensure that errors like this are very rare, but they happen. And they may be happening to you.

Post-test analysis keeps us from making bad decisions when the unexpected rears its ugly head. Here’s a primer on how conversion experts ensure they are making the right decisions by doing post-test analysis.

Did Any Of Our Test Variations Win?

The first question that will be on our lips is, “Did any of our variations win?”

There are two possible outcomes when we examine the results of an AB test.

  1. The test was inconclusive. None of the alternatives beat the control. The null hypotheses was not disproven.
  2. One or more of the treatments beat the control in a statistically significant way.

Joel Harvey of Conversion Sciences describes his process below:

Joel Harvey, Conversion ScientistJoel Harvey, Conversion Sciences

“Post-test analysis” is sort of a misnomer. A lot of analytics happens in the initial setup and throughout full ab testing process. The “post-test” insights derived from one batch of tests is the “pre-test” analytics for the next batch, and the best way to have good goals for that next batch of tests is to set the right goals during your previous split tests.

That said, when you look at the results of an AB testing round, the first thing you need to look at is whether the test was a loser, a winner, or inconclusive.

Verify that the winners were indeed winners. Look at all the core criteria: statistical significance, p-value, test length, delta size, etc. If it checks out, then the next step is to show it to 100% of traffic and look for that real-world conversion lift.

In a perfect world you could just roll it out for 2 weeks and wait, but usually, you are jumping right into creating new hypotheses and running new tests, so you have to find a balance.

Once we’ve identified the winners, it’s important to dive into segments.

  • Mobile versus non-mobile
  • Paid versus unpaid
  • Different browsers and devices
  • Different traffic channels
  • New versus returning visitors (important to setup and integrate this beforehand)

This is fairly easy to do with enterprise tools, but might require some more effort with less robust testing tools. It’s important to have a deep understanding of how tested pages performed with each segment. What’s the bounce rate? What’s the exit rate? Did we fundamentally change the way this segment is flowing through the funnel?

We want to look at this data in full, but it’s also good to remove outliers falling outside two standard deviations of the mean and re-evaluate the data.

It’s also important to pay attention to lead quality. The longer the lead cycle, the more difficult this is. In a perfect world, you can integrate the CRM, but in reality, this often doesn’t work very seamlessly.

Chris McCormick, Head of Optimisation at PRWD, describes his process:

chris-mccormickChris McCormick, PRWD

When a test concludes, we always use the testing tool as a guide but we would never hang our hat on that data. We always analyse results further within Google Analytics, as this is the purest form of data.

For any test, we always set out at the start what our ‘primary success metrics’ are. These are what we look to identify first via GA and what we communicate as a priority to the client. Once we have a high level understanding of how the test has performed, we start to dig below the surface to understand if there are any patterns or trends occurring. Examples of this would be: the day of the week, different product sets, new vs returning users, desktop vs mobile etc.

We always look to report on a rough ROI figure for any test we deliver, too. In most cases, I would look to do this based on taking data from the previous 12 months and applying whatever the lift was to that. This is always communicated to the client as a ballpark figure i.e.: circa £50k ROI. The reason for this is that there are so many additional/external influences on a test that we can never be 100% accurate; testing is not an exact science and shouldn’t be treated as such.

Are We Making Type I or Type II errors?

In our post on AB testing statistics, we discussed type I and type II errors. We work to avoid these errors at all cost.

To avoid errors in judgement, we verify the results of our testing tool against our analytics. It is very important that our testing tool send data to our analytics package telling us which variations are seen by which segments of visitors.

Our testing tools only deliver top-level results, and we’ve seen that technical errors happen. So we can reproduce the results of our AB test using analytics data.

Did each variation get the same number of conversions? Was revenue reported accurately?

Errors are best avoided by ensuring the sample size is large enough and utilizing a proper AB testing framework. Peep Laja describes his process below:

peep-lajaPeep Laja, ConversionXL

First of all I check whether there’s enough sample size and that we can trust the outcome of the test. I check if the numbers reported by the testing tool line up with the analytics tool, both for CR (conversion rate) and RPV (revenue per visit).

In the analytics tool I try to understand how the variations changed user behavior – by looking at microconversions (cart adds, certain page visits etc) and other stats like cart value, average qty per purchase etc.

If the sample size is large enough, I want to see the results of the test across key segments (provided that the results in the segments are valid, have enough volume etc), and see if the treatments performed better/worse inside the segments. Maybe there’s a case for personalization there. The segments I look at are device split (if the test was ran across multiple device categories), new/returning, traffic source, first time buyer / repeat buyer.

How Did Key Segments Perform?

In the case of an inconclusive test, we want to look at individual segments of traffic.

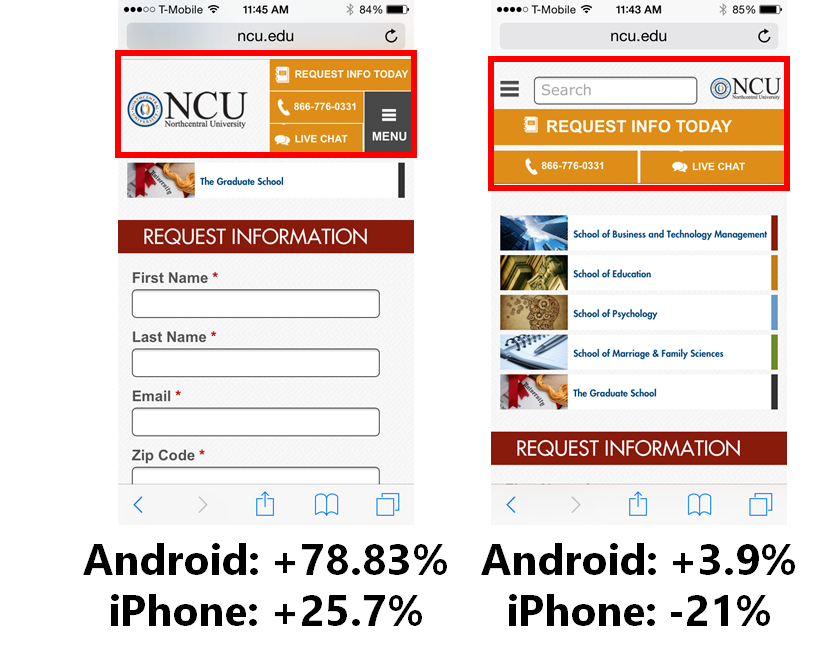
For example, we have had an inconclusive test on smartphone traffic in which the Android visitors loved our variation, but iOS visitors hated it. They cancelled each other out. Yet we would have missed an important piece of information had we not looked more closely.

pasted image 0 39

Visitors react differently depending on their device, browser and operating system.

Other segments that may perform differently may include:

  1. Return visitors vs. New visitors
  2. Chrome browsers vs. Safari browsers vs. Internet Explorer vs. …
  3. Organic traffic vs. paid traffic vs. referral traffic
  4. Email traffic vs. social media traffic
  5. Buyers of premium products vs. non-premium buyers
  6. Home page visitors vs. internal entrants

These segments will be different for each business, but provide insights that spawn new hypotheses, or even provide ways to personalize the experience.

Understanding how different segments are behaving is fundamental to good testing analysis, but it’s also important to keep the main thing the main thing, as Rich Page explains:

rich-pageRich Page, Website Optimizer

Avoid analysis paralysis. Don’t slice the results into too many segments or different analytics tools. You may often run into conflicting findings. Revenue should always be considered the best metric to pay attention to other than conversion rate, after all, what good is a result with a conversion lift if it doesn’t also increase revenue?

The key thing is not to throw out A/B tests that have inconclusive results, as this will happen quite often. This is a great opportunity to learn and create a better follow up A/B test. In particular you should gain visitor feedback regarding the page being A/B tested, and show them your variations – this helps reveal great insights into what they like and don’t like. Reviewing related visitor recordings and click maps also gives good insights.

Nick So of WiderFunnel talks about segments as well within his own process for AB test analysis:

nick-soNick So, WiderFunnel

“Besides the standard click-through rate, funnel drop-off, and conversion rate reports for post-test analysis, most of the additional reports and segments I pull are very dependent on the business context of a website’s visitors and customers.

For an ecommerce site that does a lot of email marketing and has high return buyers, I look at the difference in source traffic as well as new versus returning visitors. Discrepancies in behavior between segments can provide insights for future strategies, where you may want to focus on the behaviors of a particular segment in order to get that additional lift.

Sometimes, just for my own personal geeky curiosity, I look into seemingly random metrics to see if there are any unexpected patterns. But be warned: it’s easy to get too deep into that rabbit hole of splicing and dicing the data every which way to find some sort of pattern.

For lead-gen and B2B companies, you definitely want to look at the full buyer cycle and LTV of your visitors in order to determine the true winner of any experiment. Time and time again, I have seen tests that successfully increase lead submissions, only to discover that the quality of the leads coming through is drastically lower; which could cost a business MORE money in funnelling sales resources to unqualified leads.

In terms of post-test results analysis and validation — besides whatever statistical method your testing tool uses — I always run results through WiderFunnel’s internal results calculator which utilizes bayesian statistics to provide the risk and reward potential of each test. This allows you to make a more informed business decision, rather than simply a win/loss, significant/not significant recommendation.”

In addition to understanding how tested changes impacted each segment, it’s also useful to understand where in the customer journey those changes had the greatest impact, as Benjamin Cozon describes:

benjamin-cozonBenjamin Cozon, Uptilab

We need to consider that the end of the running phase of a test is actually the beginning of insight analysis.

Why is each variation delivering a particular conversion rate? In which cases are my variations making a difference, whether positive or negative? In order to better understand the answers to these questions, we always try to identify which user segments are the most elastic to the changes that were made.

One way we do it is by ventilating the data with session-based or user-based dimensions. Here is some of the dimension we use for almost every test:

  • User type (new / returning)
  • Prospect / new Client / returning client
  • Acquisition channel
  • Type of landing page

This type of ventilation helps us understand the impact of specific changes for users relative to their specific place in the customer journey. Having these additional insights also helps us build a strong knowledge base and communicate effectively throughout the organization.

Finally, while it is a great idea to have a rigorous quality assurance (QA) process for your tests, some may slip through the cracks. When you examine segments of your traffic, you may find one segment that performed very poorly. This may be a sign that the experience they saw was broken.

It is not unusual to see visitors using Internet Explorer crash and burn since developers abhor making customizations for that non-compliant browser.

How Did Changes Affect Lead Quality?

Post test analysis allows us to be sure that the quality of our conversions is high. It’s easy to increase conversions. But are these new conversions buying as much as the ones who saw the control?

Several of Conversion Sciences’ clients prizes phone calls and the company optimizes for them. Each week, the calls are examined to ensure the callers are qualified to buy and truly interested in a solution.

In post-test analysis, we can examine the average order value for each variation to see if buyers were buying as much as before.

We can look at the profit margins generated for the products purchased. If revenue per visit rose, did profit follow suit?

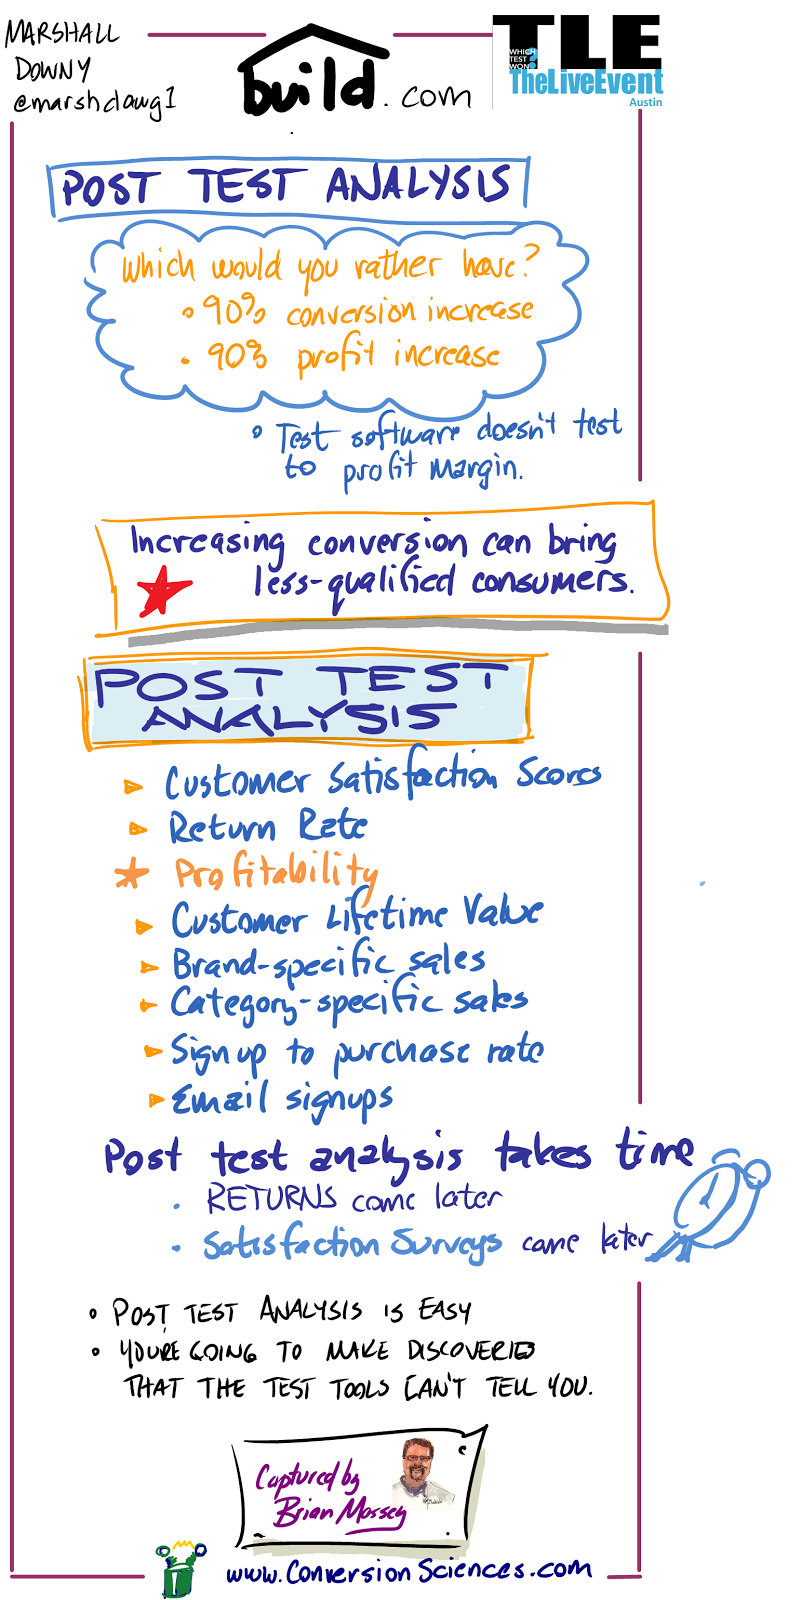
Marshall Downey of Build.com has some more ideas for us in the following instagraph infographic.

WTW TLE Post Test Analysis Instagraph Marshall Downy

Revenue is often looked to as the pre-eminent judge of lead quality, but doing so comes with it’s own pitfalls, as Ben Jesson describes in his approach to AB test analysis.

ben-jessonBen Jesson, Conversion Rate Experts

If a test doesn’t reach significance, we quickly move on to the next big idea. There are limited gains to be had from adding complexity by promoting narrow segments.

It can be priceless to run on-page surveys on the winning page, to identify opportunities for improving it further. Qualaroo and Hotjar are great for this.

Lead quality is important, and we like to tackle it from two sides. First, qualitatively: Does the challenger page do anything that is likely to reduce or increase the lead value? Second, quantitatively: How can we track leads through to the bank, so we can ensure that we’ve grown the bottom line?

You might expect that it’s better to measure revenue than to measure the number of orders. However, statistically speaking, this is often not true. A handful of random large orders can greatly skew the revenue figures. Some people recommend manually removing the outliers, but that only acknowledges the method’s intrinsic problem. How do you define outlier, and why aren’t we interested in them? If your challenger hasn’t done anything that is likely to affect the order size, then you can save time by using the number of conversions as the goal.

After every winning experiment, record the results in a database that’s segmented by industry sector, type of website, geographic location, and conversion goal. We have been doing this for a decade, and the value it brings to projects is priceless.

Analyze AB Test Results by Time and Geography

Conversion quality is important, and  Theresa Baiocco takes this one step further.

theresa-baioccoTheresa Baiocco, Conversion Max

For lead gen companies with a primary conversion goal of a phone call, it’s not enough to optimize for quantity of calls; you have to track and improve call quality. And if you’re running paid ads to get those phone calls, you need to incorporate your cost to acquire a high-quality phone call, segmented by:

  • Hour of day
  • Day of week
  • Ad position
  • Geographic location, etc

When testing for phone calls, you have to compare the data from your call tracking software with the data from your advertising. For example, if you want to know which day of the week your cost for a 5-star call is lowest, you first pull a report from your call tracking software on 5-star calls by day of week:

image00

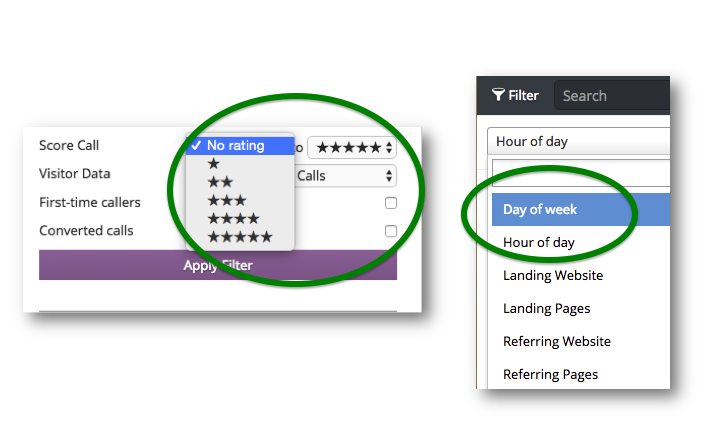
Then, check data from your advertising source, like Google AdWords. Pull a report of your cost by day of week for the same time period:

image01

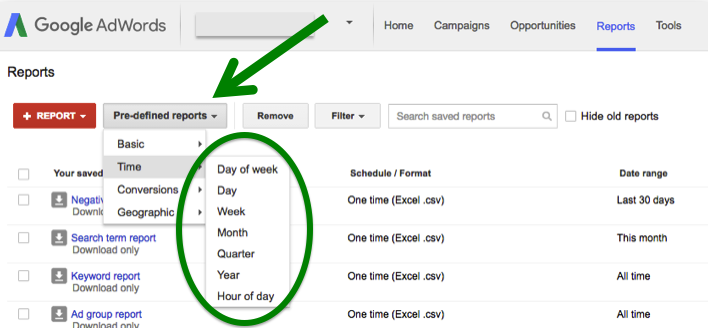
Then, you simply divide the amount you spent by the number of 5-star calls you got, to find out how much it costs to generate a 5-star call each day of the week.

image02

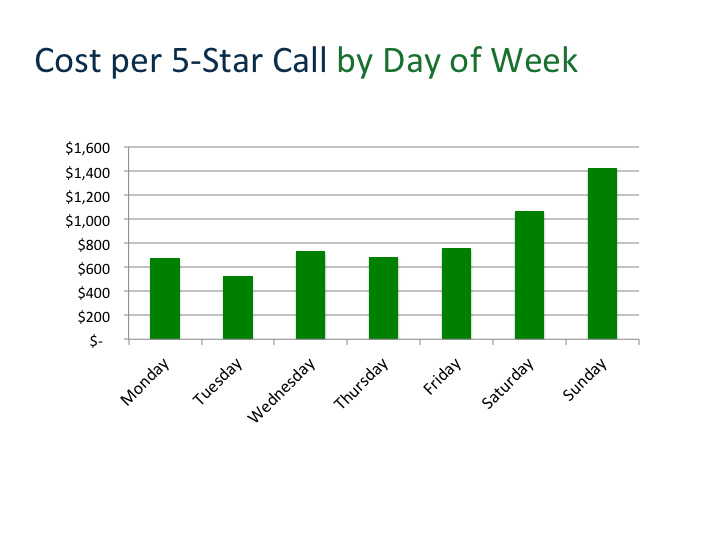
Repeat the process on other segments, such as hour of day, ad position, week of the month, geographic location, etc. By doing this extra analysis, you can shift your advertising budget to the days, times, and locations when you generate the highest quality of phone calls – for less.

Look for Unexpected Effects

Results aren’t derived in a vacuum. Any change will create ripple effects throughout a website, and some of these effects are easy to miss.

Craig Andrews gives us insight into this phenomenon via a recent discovery he made with a new client:

craig-andrewsCraig Andrews, allies4me

I stumbled across something last week – and I almost missed it because it was secondary effects of a campaign I was running. One weakness of CRO, in my honest opinion, is the transactional focus of the practice. CRO doesn’t have a good way of measuring follow-on effects.

For example, I absolutely believe pop-ups increase conversions, but at what cost? How does it impact future engagement with the brand? If you are selling commodities, then it probably isn’t a big concern. But most people want to build brand trust & brand loyalty.

We discovered a shocking level of re-engagement with content based on the quality of a visitor’s first engagement. I probably wouldn’t believe it if I hadn’t seen it personally and double-checked the analytics. In the process of doing some general reporting, we discovered that we radically increased the conversion rates of the 2 leading landing pages as secondary effects of the initial effort.

We launched a piece of content that we helped the client develop. It was a new client and the development of this content was a little painful with many iterations as everyone wanted to weigh in on it. One of our biggest challenges was getting the client to agree to change the voice & tone of the piece – to use shorter words & shorter sentences. They were used to writing in a particular way and were afraid that their prospects wouldn’t trust & respect them if they didn’t write in a highbrow academic way.

We completed the piece, created a landing page and promoted the piece primarily via email to their existing list. We didn’t promote any other piece of content all month. They had several pieces (with landing pages) that had been up all year.

It was a big success. It was the most downloaded piece of content for the entire year. It had more downloads in one month than any other piece had in total for the entire year. Actually, 28% more downloads than #2 which had been up since January.

But then, I discovered something else…

The next 2 most downloaded pieces of content spiked in October. In fact, 50% of the total year’s downloads for those pieces happened in October. I thought it may be a product of more traffic & more eyeballs. Yes that helped, but it was more than that. The conversion rates for those 2 landing pages increased 160% & 280% respectively!

We did nothing to those landing pages. We didn’t promote that content. We changed nothing except the quality of the first piece of content that we sent out in our email campaign.

Better writing increased the brand equity for this client and increased the demand for all other content.

Testing results can also be compared against an archive of past results, as Shanelle Mullin discusses here:

Shanelle Mullin, ConversionXL

shanelle-mullinThere are two benefits to archiving your old test results properly. The first is that you’ll have a clear performance trail, which is important for communicating with clients and stakeholders. The second is that you can use past learnings to develop better test ideas in the future and, essentially, foster evolutionary learning.

The clearer you can communicate the ROI of your testing program to stakeholders and clients, the better. It means more buy-in and bigger budgets.

You can archive your test results in a few different ways. Tools like Projects and Effective Experiments can help, but some people use plain ol’ Excel to archive their tests. There’s no single best way to do it.

What’s really important is the information you record. You should include: the experiment date, the audience / URL, screenshots, the hypothesis, the results, any validity factors to consider (e.g. a PR campaign was running, it was mid-December), a link to the experiment, a link to a CSV of the results, and insights gained.

Why Did We Get The Result We Got?

Ultimately, we want to answer the question, “Why?” Why did one variation win and what does it tell us about our visitors?

This is a collaborative process and speculative in nature. Asking why has two primary effects:

  1. It develops new hypotheses for testing
  2. It causes us to rearrange the hypothesis list based on new information

Our goal is to learn as we test, and asking “Why?” is the best way to cement our learnings.


21 Quick and Easy CRO Copywriting Hacks to Skyrocket Conversions

21 Quick and Easy CRO Copywriting Hacks

Keep these proven copywriting hacks in mind to make your copy convert.

  • 43 Pages with Examples
  • Assumptive Phrasing
  • "We" vs. "You"
  • Pattern Interrupts
  • The Power of Three

"*" indicates required fields

This field is for validation purposes and should be left unchanged.


Have you ever found yourself in the middle of a conversation or argument and it suddenly hits you that the two of you aren’t talking about the same thing? Then you have that brilliant “aha” moment where you can actually start making some progress.

One workplace conversation that can be particularly tricky is whether your company should redesign its website. It’s important to make sure everyone is talking about the same thing when you talk about redesign because it’s costly, risky, and emotionally charged.

There are a few common reasons companies choose to redesign their websites:

  • The site performs poorly
  • The desire to be “mobile-friendly”
  • The site is “dated”
  • The desire to be “unique”

These reasons have a common denominator: you’re not happy with a very particular aspect of your site. There are many ways you can approach finding a solution to the problem, and we – the universal We – attach the word “redesign” to those solutions even though it means one of many methods are used to get the result we want.

Synonyms for redesign from dictionary.com

Synonyms for redesign from dictionary.com

According to Dictionary.com, the above are some of the more common synonyms for “redesign”. The way Conversion Sciences uses this term is very industry-specific, so it has a certain jargon-y quality. Someone working in marketing at a tech or ecommerce company probably understands our jargon more than their colleagues in other departments.

If you’re that marketing person and you’re trying to convince your boss and other departments that you need conversion optimization, it’s really important that you’re all speaking the same language. You might be experiencing some miscommunication and not even realize it.

What are the different ways each of you might be using the word “redesign”?

Before you dismiss it as juvenile to keep returning to basic, dictionary definitions of “redesign”, make a mental tally of important people who don’t work in marketing, conversion optimization, or graphic design.

  • Your CEO and CFO, maybe your boss
  • Your customer service representatives answering chat, phone calls, and emails
  • Your customers

All of us feel great satisfaction in knowing the real definition, but ultimately being right isn’t helpful if no one understands each other.

A Full Redesign: Starting Over From Scratch

When we say “redesign” in its purest sense, we mean a brand spanking new website. You hired a designer, you have a new color palette and CSS, you completely threw out the old. Every page is new, the entire structure is different.

Redesign can be used to mean a brand spanking new experience

“Redesign” can be used to mean a brand spanking new experience

When Conversion Sciences cautions against redesigns, this is the definition we’re using. We say there are only two good reasons to undertake a website redesign:

  1. You are re-branding or
  2. Your CMS (content management system) is too limiting

When I worked at Westbank Library our website used a proprietary CMS built by the company that built our ILS (integrated library system). An ILS is used to search for books or connect to an online resource or check to see when books are due back. In other words, an ILS isn’t meant to be the platform for a very specific kind of online application.

Westbank's homepage in 2008, built with a CMS that was only intended to be used for online library catalogs

Westbank’s homepage in 2008, built with a CMS that was only intended to be used for online library catalogs (screenshot via the Way Back Machine)

The ILS wouldn’t support some very important non-book-related features:

  • We couldn’t optimize the site for the search engines
  • We couldn’t embed a calendar
  • We couldn’t choose which photos appeared where on the page
  • We couldn’t create customized landing pages for special events
  • We couldn’t make the site ADA compliant
  • We couldn’t add widgets other libraries were using

We needed a new site built on a new CMS, one that met our present-day needs. The only way to do that was to dump the old one. The new website was built using Drupal, and it meant everything was new. The change was necessary and long overdue.

Westbank's new homepage after the from-scratch redesign

Westbank’s new homepage after the from-scratch redesign (screenshot via the Way Back Machine, which is why the images aren’t loading)

We were excited that on smartphones, the phone number was tel-linked and that the site was now searchable without going back to Google. Best of all, we had an actual, legitimate calendar. Before the redesign, the best we could do was make a list of what was going on.

Calendar of events on old site

Calendar of events on old site

After the redesign, people could see an actual calendar with clickable events where they could go find more information.

Calendar of events on new site

Calendar of events on new site

Without a doubt, the new site was an immense improvement. The lack of functionality on the old site was crippling us.
In this case, a full redesign was justified, but the results weren’t what we had hoped.


21 Quick and Easy CRO Copywriting Hacks to Skyrocket Conversions

21 Quick and Easy CRO Copywriting Hacks

Keep these proven copywriting hacks in mind to make your copy convert.

  • 43 Pages with Examples
  • Assumptive Phrasing
  • "We" vs. "You"
  • Pattern Interrupts
  • The Power of Three

"*" indicates required fields

This field is for validation purposes and should be left unchanged.


Conversion Optimization as Redesign: Making Incremental Changes

When the new site launched, our traffic went through the roof – hundreds of times more people were visiting our website. But since the change was long overdue, people who used the old site for a decade were totally lost.

Dozens of people called us saying “I can’t find anything on this new website, you need to redesign it!” and dozens more sent us angry emails saying the same. With the amount of time we spent working on the new website, it was disheartening to hear. Small public libraries don’t have the resources to do projects like this often – and in some cases, they can’t do projects like it at all. We knew we’d been fortunate, and we were suddenly terrified we had blown our only chance to fix our site. There were very serious discussions of applying for grants, then hiring a new design team to start over.

But after spending time talking to our patrons, we’d find out what they actually meant by “redesign”.

In one case, a gentlemen received an email reminding him to renew his books and included a link for him to do it online. Before our redesign, that link took him to his library account where he was automatically logged in on his home computer. All he had to do was click “renew”. After the redesign, this link took him to our homepage, so he had no idea where to go. When we say that your landing pages need to fulfill the promises you’ve made in your ad, this is a great example of what we’re talking about. Instead of changing the design of anything, we needed to fix that link.

Another way we knew people were lost is by analyzing how they used the site.

One problem in particular was how people used our site’s search box. All of the searches were for titles of popular books and movies, but the search box wasn’t connected to the online catalog. Our old site had one search box, and its only use was to look for books and movies. Everyone assumed the new search box had the same function, but it didn’t.

Our search bar at the launch of our new site.

Search options on the new website

We used the data from our search box the same way you can use heat maps. You can accommodate how your visitors are already using your site with the data you gather. Instead of forcing them to use our search box the way we wanted, we changed it to do what they wanted.

But that change meant our visitors, once again, didn’t have a site search option.

We changed the site search bar to be a catalog search, but it still wasn't perfect

We changed the site search bar to be a catalog search, but it still wasn’t perfect

From this point, we found a widget that gave us a more dynamic search bar. Then we replaced images at the bottom of the page that linked to adult, teen, and children’s programs with widgets featuring new books and the library’s Instagram account. And we featured upcoming events more prominently, moved the contact information into the footer, added navigational links along the top of the page, and worked to make the site ADA compliant. The current homepage design is very different compared to what it was when we first rolled out the new website.

The homepage as it is now

The homepage as it is now

These changes were slow-going, careful, and made one at a time. The redesign 1.0 and current iteration look similar because of branding and tabbed browsing, but for library patrons, these are two very disparate experiences. It is safe to say the new homepage underwent another redesign, but you might hesitate to use that word because the changes didn’t happen all at once.


Looking back at synonyms of “redesign”…

Redesign can be used to describe incremental changes

“Redesign” can be used to describe incremental changes

The website wasn’t perfect, but there was a lot to work with. We couldn’t start over every time we realized the site could be doing better.

Big Swings as Redesign: Changing Several Variables at Once

We use the term “big swing” to talk about sweeping changes we make on a page. Often these changes are on a page that’s particularly important or special, like a homepage or landing page.

It means we’ve changed several features all at once instead of testing one thing at a time. The downside of this strategy is that no matter how the page performs after the test goes live, we don’t really know why. If the page continues to perform with the exact same conversion rate, we don’t really know why: our changes may have offset each other.

Big, sweeping changes are exciting when they are successful, and people love to share these kinds of successes. They make great headlines and engaging stories. They give us hope that our big change will work out the way we want, or perhaps even better than we imagine. The problem is that there are usually third variables at play in these stories.

Think about the diet book industry. Every book boasts of its followers’ drastic life improvements due entirely to the diet. But when someone starts to pay attention to what she eats, she may also make other changes like exercising more, quitting smoking, and getting more frequent checkups with her doctor. Was her success really due to the diet book? Or was it purely chance since she made so many other changes? There’s no way to know.

Michael Scott’s Big Swing

Humans have the potential to be rational, logical creatures, but we often fall prey to our emotions when we make decisions, dole out praise, or attach blame. In an episode of The Office, Office Manager Michael Scott has the brilliant, big idea to send out paper shipments with five golden tickets tucked into the boxes at random. Each ticket awarded a 10% discount to its recipient.

The promotion quickly goes south when Dunder Mifflin’s largest client receives all five tickets, and there are no disclaimers or expiration dates. Michael arranges for a fall guy who will be fired for the idea, but then finds out this client has decided to send Dunder Mifflin even more business because of the discount. Naturally Michael wants the credit but doesn’t want to be reprimanded for almost bankrupting the company.

Michael Scott dressed as Willy Wonka, presenting his Golden Ticket idea

Michael Scott dressed as Willy Wonka, presenting his Golden Ticket idea

The Golden Ticket promotion was a big swing because Dunder Mifflin didn’t isolate the variable Michael was hoping to test: will current clients be more loyal to Dunder Mifflin because of a special, one-time-only, 10% discount?

The consequences of the Golden Ticket run the gamut of possible results of big swings:

  • Positive Result: When it seemed like the promotion would put Dunder Mifflin out of business, the responsible party was fired
  • Negative Result: When it became apparent the promotion would solidify a relationship with an important client, the responsible party was publicly commended
  • Neutral Result: Dunder Mifflin lost a huge amount of revenue due to the promotion, then gained more revenue, also due to the promotion

Big Swings at Conversion Sciences

In a staff meeting last week, Conversion Scientist Megan Hoover told us, “We completely redesigned this landing page for our client, and it was a big improvement”. In a different staff meeting, fellow Conversion Scientist Chris Nolan told us, “Our first test was to redesign our client’s homepage, and it was a huge success”.

Conversion Sciences doesn’t do website redesigns, we do conversion optimization. So what did Megan and Chris mean?

  • We switched from two columns to three
  • We wrote a new headline
  • We changed the copy
  • We changed the wording on the call to action

These changes mean they were speaking accurately when they described their big swings as “redesigns”.

Redesign describes what we do when we do big swings

“Redesign” describes what we do when we make big swings

We didn’t change the functionality of the page, the page’s purpose, or the CMS. We definitely made some big changes, but we certainly didn’t start from scratch, and all of the changes were very localized to a landing page and a homepage.

It’s worth noting that even though it’s tough to measure results when you make a big swing type of redesign, we still take the risk sometimes because Conversion Sciences has run so many successful tests. We are very good at making educated hypotheses about what kinds of changes will work well together, but we don’t attempt these big changes often. There is a lot of room for error in the big swing.

What is Your Desired End Result?

We covered three approaches to redesign in this post:

  1. Throw-out the old, start from scratch
  2. Incremental changes
  3. Big swings

Let’s return to the most common reasons a company chooses to redesign:

  • The site performs poorly
  • The desire to be “mobile-friendly”
  • The site is “dated”
  • The desire to be “unique”

When you have the conversation at work about redesigning your site, try starting with the end goal.

If you work backwards, the conversation has a good chance of staying on track because it’s likely that everyone wants the same thing, even if it comes out of their mouths sounding very different. I’m willing to bet that everyone wants a home page with lower bounce rates. Everyone wants to reduce cart abandonment rates. Everyone wants more downloads of your industry reports. Everyone wants to sell more merchandise.

Redesigns are seductive. They come with big budgets and a chance to make a visible impact. The question at the heart of my arguments is this: do you need a website redesign, or do you need a website optimization program?

An optimization program can begin delivering results within weeks. Full redesigns take months and months to develop. An optimization program tells you which of your assumptions are good ones. Full redesigns are big gambles.

With a short Conversion Strategy Session, you will be able to make the case for a full redesign or optimization program for your growing online business. Request your free session.
Brian Massey

If you compete online in the retail electronics industry, there is ample opportunity, according to a study completed by Conversion Sciences and Marketizator.

The full report, Optimization Practices of Retail Electronics Websites, can be downloaded for free. It is the latest in our series of industry report cards that include reports on Higher Education, and B2B Ecommerce.

Who Should Read The Report

The report is a report card on the adoption of key website optimization tools for businesses advertising on “electronics” search keywords. It is meant for managers of websites competing for a slice of the retail electronics market like:

  • Retailers of digital cameras, TVs, home theater, and tablets.
  • Retailers of complimentary products, such as computers and laptops.

We believe that the lessons learned here can be applied to any online retail business with high-prices and commoditized products.

Why Focus on Website Optimization?

There is a set of tools and disciplines designed to increase the number of sales and leads generated from the traffic coming to a business website. Collectively, they are called website optimization.

In the seasonal online retail space, websites seek to achieve one or more of the following goals:

  • Increase the revenue generated per capita, also known as “revenue per visitor.”
  • Reduce shopping cart “abandonment” in which visitors add items to cart, but do not purchase.
  • Increase the average size of each order, or “average order value.”
  • Decrease bounce rates for traffic from paid advertising.

Website optimization utilizes easily-collected information to identify problems and omissions on these sites that may prevent achievement of these goals.

This information can be collected in several ways:

  • Web analytics tools track prospect’s journey through a site. Examples include Adobe SiteCatalyst and Google Analytics.
  • Click-tracking tools (also called heat map tools) that track where a prospects are clicking and how far they are scrolling. This reveals functional problems on specific pages.
  • Screen Recording tools will record visitor sessions for analysis.
  • Split testing, or A/B testing tools allow marketers to try different content and design elements to see which generate more inquiries.
  • Site Performance tools help companies increase the speed with which a website loads. Page speed correlates with conversion performance.
  • Social Analytics track the performance of social interactions relating to the site, such as likes, shares, and social form fills.
  • User Feedback tools provide feedback directly from visitors on the quality of the site and content.

The existence of these tools on a website indicates that the site is collecting important information that can be used to decrease the cost of acquiring new prospects and customers.

This is a strong competitive advantage. Increasing conversion rates decreases acquisition costs, which means:

  • All advertising gets cheaper.
  • Businesses can outperform competitors with bigger advertising budgets
  • Businesses reliant on SEO aren’t as vulnerable to algorithm changes.

This report targets companies investing in search advertising in a variety of formats.

How much are these businesses pending on paid online advertising?

Of the businesses competing for consumer electronics sales, 83% are spending between $500 per month and $5000 per month on paid search ads. See Figure 1.

Fourteen percent are spending between $5000 and $50,000 per month, and only 3% spend more than $50,000.

Figure 1: Range of spending on paid search ads by businesses.

Figure 1: Range of spending on paid search ads by businesses.

Web Analytics Investments

Of the organizations that spend at least $500 per month on search ads, 75% have some form of Web Analytics installed on their site. Web Analytics is a broad category of web software that in some way measures the behavior of visitors to a site. It includes most of the website optimization tools discussed in this report.

Figure 2: Breakdown of web analytics installations by ad spend.

Figure 2: Breakdown of web analytics installations by ad spend.

When we break the list down into categories of spending, we find that the highest-spending organizations are less likely to have web analytics installed (77%) despite having the most to lose.

Google Analytics, a free tool, is the most pervasive analytics package, found on 77% of the sites with analytics. Adobe SiteCatalyst (formerly Omniture) is installed on 4.5% of these sites.

Optimization Software Investments

By looking at the software installed on the websites in the asset and inventory marketplace, we can get an idea of how these organizations are investing in the tools of optimization.

This doesn’t tell us how many are making good use of these tools, but indicates how many have the potential to optimize their site.

The graphic in Figure 3 shows that retailers spending $50,000 on search ads are most likely to invest in

optimization tools. Of this segment, 24% have at least one of these tools installed vs. 7.7% for the entire industry.

The largest spenders focus investments on A/B testing tools, social analytics and survey feedback solutions.

Figure 3: Adoption rate of Web optimization tools by ad spend.

Figure 3: Adoption rate of Web optimization tools by ad spend.

Use of AB Testing Tools

It is clear from the information presented here that, the largest group of retailers – those spending between $500 and $5000 each month on search ads — invest the least in AB testing tools. Furthermore, they invest most in social media analytics tools with 6.1%.

The question is this: Do they not have the tools budget because they don’t invest in website optimization, or do they not have the tools because they don’t see optimization as important.

Certainly, both are true for some portion of the sample. However, 75% of all organizations spending at least $500 a month have web analytics installed. At some point, most of the industry came to the conclusion that you must understand the basics of your traffic.

Yet, only 7.7% have at least one website optimization tool installed.

Over 82% of organizations spending between $5,000 and $50,000 have web analytics installed, and 15.6% have some sort of investment in optimization tools.

Recommendations

Give Your Team Time to Review Analytics

Most of the businesses in our review – 75% – have gotten the message that web analytics should be installed on their website. The majority of these have installed Google Analytics, a free package with capacity to capture the behavior of their visitors.

The value of an analytics database like this is in the insights it can provide. Incentivizing your team to glean insights from this analytics database will guide online investment decisions, increasing the performance of the website.

Businesses with Smaller Ad Spends Should Focus More on Reducing Acquisition Cost

Those businesses with larger ad spends are able to bid more for better placement on their ads. Those with smaller budgets, however, will win by reducing the overall acquisition cost.

Businesses with low acquisition costs get more inquiries for less money. This is the leverage businesses with fewer resources need.

Those businesses that learn to optimize the fastest will gain a cost advantage in paid ad auctions. An investment in free and inexpensive tools, such as click tracking, screen recording and site performance solutions will tip the scales.

Given the low adoption rate of so many of these tools, schools with few resources are in a position to disrupt their competitors by investing in them.

Leverage Your Comparatively High Purchase Price

For those businesses with higher average order values, small increases in conversion rates will deliver big increases in revenue. In short, it takes less time to get your money back from an investment in website optimization.

This can be seen in the relatively high adoption rate of A/B testing tools by businesses spending between $500 and $5000 per month (21%). While these tools require a more formal discipline, they are very effective at finding increases in conversion rates month after month.

There is still a significant opportunity for businesses spending below $5,000 to drive acquisition costs down with testing.

Decrease Your Search Ad Costs

Google favors sites with better performance. The search engine gives advertisers with more relevant sites ad placement higher on the page. Data indicates that sites with lower bounce rates are given a higher quality score than sites that elicit “pogo-sticking”, that is, sites for which visitors are returning to search results pages quickly.

Website optimization will reduce bounce rates by getting visitors into the site before they jump back to their search results.

Don’t Over Invest in Social Media Sharing

It is telling that social analytics tools have the highest adoption rates among consumer electronics retailers.

Social ads are delivering qualified traffic at a relatively low cost. In our experience, social sharing has not.

Your analytics will reveal if social traffic is delivering new leads and sales for your business. If the results aren’t there, consider using this investment elsewhere.

Begin Adoption Soon

Retail marketers are clearly behind the curve in terms of their adoption of website optimization tools. This creates an opportunity in the market. However, this window will close.

As more businesses begin optimizing, it will become harder more expensive to compete for prospects online.

The Conversion Scientists are reading some good stuff at the moment. Do you have any to add?

From Venngage – “7 Reasons Why Clicking This Title Will Prove Why You Clicked This Title”

“I don’t know about you, but anytime I see or hear mention of a story about a dog or a cute panda sneezing or a hippo farting, I get excited and immediately need to read or see more.”
The kind of traffic that comes to a “Clickbait” headline is often not well qualified. People come because of the headline’s hook, not because they need a product or service.
Having said that, the psychology of these headlines can be used to draw a more qualified audience to a content piece or landing page. Many of the best-performing headlines we’ve tested are abrupt and unexpected. It’s something they have in common with clickbait headlines: 79% of the ones analyzed in the Venngage used the element of shock.
So I offer this little study of click bait headlines. It’s worth the read if only for the dog videos. (Plus it turns out the farting hippo thing is real.)
Read more.

From Medium – “Making a Murderer: 7 Hilarious Things Wrong with Ken Kratz’s Website”

We don’t normally advocate for website redesigns. In fact, we think there are only two good reasons to do them:

  1. Rebranding or repositioning
  2. A poor content management system (CMS)

Kratz’s website might fall into both of those categories.
“If Ken Kratz had a child build his website without his awareness and did not make changes at the fear of hurting their feelings, then that would be a permissible excuse.”
Enough said.
Read more.

From The Washington Post – “The surprising psychology of shoppers and return policies”

“Overall, a lenient return policy did indeed correlate with more returns. But, crucially, it was even more strongly correlated with an increase in purchases. In other words, retailers are generally getting a clear sales benefit from giving customers the assurance of a return.”
It’s counterintuitive that sales increase when you give people more chances to return what they buy, but the data is there. Return policies are important: two thirds of eCommerce shoppers look at them, and these policies are a large part of how consumers choose where to buy what they want.
Read more.
[forfurtherstudy]

One video can be the source of all kinds of marketing content

Now, we all know that video is a great way for us to tell a story and communicate with our prospects, with our customers, and with suspects – people who may not even know what our business does. But have you thought about how powerful video is in terms of communicating with the rest of the team?

A content strategy includes content from a number different sources – blog posts, infographs, reports, white papers, e-books. Your options are almost unlimited.

Watch all lessons in this series on converting with video.

Solving the Subject Matter Expert Problem

The biggest challenge is what I call the subject matter expert problem. How do you get the knowledge out of the subject matter experts heads — either in your company or in your industry — and get them to turn what they know into these content?
The good news is you’ve got video.

It could be video like the talking head video above. It could be explainer videos that you’ve made, and even something as simple as webinar videos – videos captured while somebody delivered a webinar. The beauty of all of these forms of video is that the subject matter expert has sat down and thought about how they would explain what they want to teach on video.

Business Video Provides Everything Your Content Team Needs

Now, if you take that video and you hand it to the people who are producing your content, they should have everything they need, everything from how to lay it out and how to organize the explanations, and the thoughts, and the education, plus the graphics that come along with video.

Think about making video that’s not just for your prospects and clients. Think about making it for your internal team so that one video can cascade  and turn it into whole bunch of other kinds of content. This page was ripped from the above video.

The Blue Line is a Metaphor for Conversion

The Conversion Function is the number of actions taken for an online property divided by the number of visits to that property.
Here is where we find the solid blue line in our websites.
It runs through our sites and our landing pages. It slices our prospects’ mobile phones, their tablets and their computers.

We Pay for Our Visitors

We charter the digital transportation that will bring people in under the line, these confounding and complex people we call visitors.
This is not an inexpensive undertaking.
We cajole Google with it’s menagerie of penguins, pandas and hummingbirds. We cast our banners and our ads across the internet, chasing prospects as they surf. We create the content, we share on social, and we send the emails that bring them to us.
We pay their fares promising them a trip to a place meant for them. Our place.

Our Visitors Want to Convert

They arrive below the line, looking for that solution, that thing that will make them feel better, that product to adorn themselves, that moment of entertainment when they can let go.
The blue line stands as a ceiling to our visitors and they image how things might be different if they could just get up there.
Above the line.
They are always tempted by the exit, the back button, the next search.
It is this blue line that our visitors struggle with, which means that we as online businesses struggle with it, too.
Some will climb. Others will accept the help of friends and strangers.
We create the line. We draw our blue line. Sometimes higher. Sometimes lower.

Conversion Optimization Helps Them Rise Above the Line

It is our duty help of our visitors to rise above this line.
We choose the tools that will elevate them.
Will we give them just enough rope to hang themselves?
Will we provide the clear steps, to boost them in their efforts?
Will we ask them to make a leap of faith and trust in their agility to spring safely above our blue line?
Will we try to make it effortless using the machinery of our websites to transport them above the line?
And what will drive them take that leap, to step on, to push the “up” button.
The vision we have for our blue line is one in which many make the journey. They come with their money in hand, ready to spend, ready to engage.
We see them coming with ample intuition and a nourishing supply of common sense, all calibrated by the way we see our business, ourselves and our world.
As it turns out what we “call sense” isn’t that common.
These frustrating people we call visitors aren’t like us. They aren’t even like the people we know. They come with their own rules, with their own ideas of beauty and their own sense of how things should work.
They are not here to be manipulated. They are here to be understood.

Why Visitors Leave Your Site

When they are not understood, they seem mesmerized by the exit, transfixed and hypnotized. We paid to bring them here and they, in their flagrant individuality choose not to stay.
In our hubris, we create the quicksand that will trap them. Did our navigation confuse them, do our words lack clarity, did we call them to act in the way they like to act?
We are opaque to them, and this is scary. Our visitors fear us like a bad dream on Halloween. Are we lurking behind our website, ready to pounce, to steal from them or, worse, to make them feel stupid and incompetent?
Do we fear being known for who we really are? For it is the unknown that allows our visitors imaginations to run to places we did not expect them to go.

A Complex Problem

How are we dealing with this complexity? For this is a complex problem.
How high will we set our line? What distance must these lost souls cover to find their solution?
What have we provided them? Why should they put their fears aside? How will we transport them above the line?
For it is their journey from below the blue line that tells us who they are and who we should be for them.
Our job at Conversion Sciences is Conversion Rate Optimization.
Our job is to get your visitors above the Blue Line.

Find out how Conversion Sciences gets more of your visitors above the Blue Line.


Editor’s Note: For our new year, we thought we would look back, way back to November 29, 2009. Did I ever really look that good?

“Conversion is a science and an art. If you get the science right, you get to have fun with the art.”

Jonas Lamis at Tech Ranch invited me to sit down with him and talk about my favorite topic: conversion.

For some unknown reason, I was succinct and somewhat articulate. Go figger.

Watch the video to find out why you might need a Conversion Scientist in your business. I also give my best advice to any entrepreneur who wants to make the Web a key strategy in their business.


Brian Massey and Jonas Lamis talk Conversion

Register for BYOContent: The Extreme Conversion Makeover and see for yourself how to turn content into leads and sales.

What are the Conversion Scientists reading these days?

Forbes: Why CRO Is Absolutely Essential in 2015

Forbes doesn’t mince words when talking about CRO. Author Niel Patel has built several online businesses, including CrazyEgg and KISSMetrics. He would know.
The article starts off with a great insignt: “Conversion optimizaiton works.”
So, how did you do this year?
Read more.

Conversion Conference: 8 Qualities of Successful Conversion Rate Optimizers

Lance Loveday’s keynote presentation at Conversion Conference this year shared eight traits that gifted CRO experts share. Wouldn’t you know it that Conversion Science’s own Brian Massey and Joel Harvey both ranked in Conversion Conference’s top 25 conversion experts in 2015, so they’ve definitely hit all of Lance’s high points.
Which of these qualities most helps you excel at CRO?
Read more.

The optimization industry is plagued most by a  poor acronym: CRO. Here is my reasoning for changing this damaging moniker.

The Importance of Acronyms

The three letter acronym (TLA) that defines an industry or organization is crucial to its success.

We all know of organizations who’ve been carried by their TLA. IBM comes immediately to mind. Here is a company that is universally recognized by its TLA. More recently, the search engine optimization industry has enjoyed significant success with the SEO TLA.

Industries with poor TLAs have fared much worse. Remember the WOM industry? Neither do we. In fact the entire social media industry has fallen on hard times due in part to the lack of a compelling TLA. SMM? Please! It’s basically a mumble.

Several industries have even consolidated their TLAs in an effort to get traction. Social media teamed up with local search and mobile to create Social Local Mobile, or SLM. When this didn’t work, they tried to slip a few more letters in. Hey, SoLoMo people, lower-case letters are still letters! This is really an acronym haiku.

Today, the TLA for the conversion optimization industry is CRO, or Conversion Rate Optimization. This is a sad moniker for a set of disciplines that offers so much promise. The conversion rate is the number of transactions or leads generated divided by the traffic for a given period of time. It is a metric of optimization, not the thing we are optimizing. Anyone can easily increase the conversion rate of any ecommerce site by cutting all prices in half. This would bankrupt almost any business, however.

Why Conversion Rate? It’s like naming our industry Bounce Rate Optimization (BRO) or Revenue Per Visit Optimization (RPVO). No, we don’t optimize conversion rates alone, so CRO is fundamentally flawed.

CRO Alternatives

Despite the cool allusion to a black carrion bird, it cannot stand. We can say we optimize for conversion, and could call the industry “CO”, but a quick letter count reveals that this is a two-letter acronym (TA). We spend most of our time optimizing websites, so website optimization, or WSO would work. But we have to come clean and admit that “website” is just one word, and “WO” is a TA. Furthermore, WSO is owned by the World Safety Organization.

We can upgrade our TAs to TLAs by adding ancillary words. Online Conversion Optimization gives us OCO. Since we’re really optimizing for revenue, we might embrace Online Revenue Optimization, or ORO. We could use the SoLoMo approach and call it OReO, but the makers of a certain sandwich cookie may take issue with this.

Join the Cross-out Protest

In addition, I recommend that you write CRO with the “R” crossed out anytime you use it on the web. This is our visible protest. Here is the HTML:

C<strike>R</strike>O

or

C<span style=”text-decoration:line-through;”>R</span>O

Use this in your blog posts, marketing or anywhere you want people to know that YOU DO NOT OPTIMIZE CONVERSION RATE ALONE.

We just finished a webinar on PPC and CRO that was, for me, one of the most fascinating I’ve participated in.
The reason is that Jim McKinley of 360Partners brought in some very interesting data on the relationship between PPC and CRO. You know how data gets me excited.
We also got some good questions that I’ll answer in this post. But first, the data.

The “Market Clearing” PPC Bid Range

This is the graph that got me excited.

The "S" graph of CPC vs. Clicks

The “S” graph of paid search CPC vs. Clicks


If you took a keyword set, slowly changed the maximum bid and recorded the volume of clicks you were getting, you’d likely get a curve like this. The gray area indicates the part of the curve in which small changes in cost per click (CPC) deliver large changes in the traffic volume.
This is the price range at which more of your ads win, at which you get more traffic for your money. Traffic “clears” at these market prices.
Jim showed us an example from real life.
Many PPC campaigns have bid-ranges in "no-mans land."

Many PPC campaigns have bid-ranges in “no-mans land.”


Here, you can see that “Client X” is in a marketplace in which the “Market Clearing CPC” is between $1.00 and $2.00 for a group of brand keywords. Yet, this client can’t be profitable at that level. They only make money on clicks prices between $0.30 and $0.60.
What are their choices? They can invest in other advertising strategies, or they can increase the number of clients they get from these clicks, making each click more profitable.
Jim’s team recommended that they NOT invest in paid search until they took some time to optimize their website.
Conversion rate optimization (CRO) can move your bid range into the sweet spot by reducing acquisition cost.

Conversion rate optimization (CRO) can move your bid range into the sweet spot by reducing acquisition cost.


This is the effect that conversion rate optimization has on paid search. It allows advertisers to bid at those high-return rates, the “market-clearing” rates.
If this doesn’t get you excited about the possibilities of combining PPC and CRO, you should have someone check your pulse.

Conversion + Search is a Natural Match

This shouldn’t really come as a surprise. The conversion rate is a function of both the traffic quality and the website effectiveness.
Paid search traffic is high-intent traffic. With the right ad this traffic can be phenomenal. Add to that an amazing landing page that keeps the promise of the ad and you have a powerful revenue-generating engine.

Conversion rate is calculated by dividing action (conversions) by visits (searches).

Conversion rate is calculated by dividing action (conversions) by visits (searches).

It’s Hard to do in One Agency

We talked at some length about the pros and cons of doing everything under one agency roof. It’s not easy.
The bulk of PPC services is billed on a “percentage of spend” model. Search traffic is bought like broadcast media, TV and Radio. Agencies have typically done their work and taken a percentage of the advertising fees paid to the TV or Radio networks. And now they take a percentage of fees paid to Google and Bing.
One thing we were clear on is this:

You can’t optimize a site for a percentage of spend.
You can’t optimize a site for a percentage of spend. Jim’s team did the numbers, comparing the hours worked on projects to the percentage of spend coming from them. There was no more room for the kind of optimization that will make a difference.
Why do search agencies claim to do conversion optimization?

Three Types of Conversion Optimization

There are several levels of conversion optimization. The first is “better than nothing” optimization in which someone with experience applied conversion best practices. We stopped doing this at Conversion Sciences because it just doesn’t work, unless you get lucky.
The second is data-driven optimization, in which you make changes to a site based on data from analytics, mouse-tracking heat maps, session recordings, and surveys. In essence, you’re deducing best practices for a site.
The third is test-driven optimization. Those ideas you want to try that don’t have the support of data should be tested. We see split tests as the Supreme Court of data. This tells us exactly what will increase conversion and revenue, and by how much.
The fourth type of conversion optimization require a small team. A data scientist, a developer and a designer. This assumes the data scientist knows how to setup and QA a test. This doesn’t come cheap.

CRO Tools are New-ish

A PPC agency is going to have team members familiar with the collection and exercise of data. A design and development team is also common in such an agency.
However, the tools that make test-driven optimization affordable are relatively new, coming to maturity in the last four years. They are powerful and easy to misuse. Experience is the key.
The marketplace has a supply of experienced search experts. Conversion optimization experts are currently harder to find.

Conclusions

If I were to sum up our conversation, it would probably be that you must invest in both search marketing and conversion optimization to be competitive in the marketplace. The value proposition is just too strong.
Today investing in SEM and CRO will usually mean hiring two different agencies to do the work, or one agency charging a flat rate or time-and-materials for the combined service.
Agencies that staff for conversion optimization as a service offering will find it much more profitable than their search services, and this will be true for some time.

Questions from the Webinar

Bobby asked, “Once the in-house talent / resource gap is tighter where do you see CRO going next?”

The industry has been enabled by tools. I think the tools will get better and smarter, including using machine learning for real-time personalization. The role of the data scientist won’t go away, though. The machines can’t come up with hypotheses to test nor creative to try.

Rachelle noted that, “You are identifying the challenges between CRO and SEM services, however, many clients are looking for a packaged solution. What do you see as the offering around those type of requests? Are the clients going to need to continue to look for separate agencies to handle both segments?”

We think it will be separate agencies for now, but the value proposition of the combined service, and the profitability of conversion optimization in particular make integration a strong candidate.

PJ said, “I’m involving the sales team and using a CRM to take CRO to revenue.”

It is crucial to drive search and conversion down to the bottom line. For long-sales cycle offerings, the CRM is a requirement. You can pump more and more leads into the system, but if they are closing at a lower rate, you’re just spinning your wheels.

© Copyright 2007 - 2025 • Conversion Sciences • All Rights Reserved
Conversion Sciences® and Conversion Scientist® are
federally registered trademarks of Conversion Sciences LLC.
Any unauthorized use is expressly prohibited.