REQUEST A CONVERSION STRATEGY SESSION   |   888-961-6604
Conversion Sciences
  • CRO Services
  • Guaranteed Redesign
  • About
  • Contact
  • Book a Consultation
  • Menu Menu

Use Data from Click Tracking Heat Maps to Increase Conversions

Conversion Optimization

I am one of the many people obsessed with increasing conversion rates.  Were you to wake me up in the middle of the night with the word ‘conversion,’ I would probably respond with a long, haunting sigh, “…raaaates.”
That’s how much I’ve been possessed by the topic.
I’ve seen lots of unsuccessful attempts at increasing conversion rates based on conventional wisdom that isn’t necessarily backed up with data. Make your calls-to-action (CTAs) big! Change your layout!  Make it scroll horizontally and design it in Adobe Flash!  One funeral home changed all their colors to blacks, and it proved to be successful in increasing conversion rates: it is bound to work for you, even if you sell lollipops!
The lists are endless, and sometimes they are just empty promises.

What you really need is data: tangible, real-life data which is related directly to you, your website and your customers’ needs.
Click tracking is one of the methods for gathering real data about what your website’s visitors do. It is a good start when optimizing your design and understanding how your customers behave and why.

What is Click Tracking?

By using a click tracking tool, you can see where your users place their cursor and press the mouse button, usually in the form of a convenient heat map.  The studies are qualitative and allow you to have tons of participants.
You can learn a lot from these studies such as where people focus their clicks the most, whether they react to the buttons placed on the website, whether they navigate the website properly, is something distracting them and so on. You figure out the questions, and click tracking will provide the answers.
What are the benefits?  First of all, the study is incredibly cheap – you don’t have to gather tons of participants in a lab and pay them; you can do it remotely and even without your users’ knowledge. Secondly, because the study is not overt, visitors on your site behave normally rather than exhibiting the unnatural behaviors inherent in those being observed.  They simply react to visuals like they usually would because they are in their natural environment.
Armed with this knowledge, you are well on your way to optimizing your website’s design and increasing conversions.

Case Studies

The North Face & ClickTale
ClickTale is one of the services offering click tracking, and one of their clients, The North Face, wanted to increase the conversion rate of their shopping cart, but their own tools had been inadequate in accomplishing that goal.
With the heat maps provided by ClickTale, The North Face saw that many users didn’t pay attention to the checkout button on the shopping cart page. Instead, they were focused on the promotional banner above the button, which invited everybody to become a rewards member.
While attracting more rewards members was one of the goals for The North Face, the placement of the banner resulted in the loss of potential conversions in the shopping cart.
In order to fix that problem, they ran an A/B test which tested a different position of the checkout button. The results were much better:
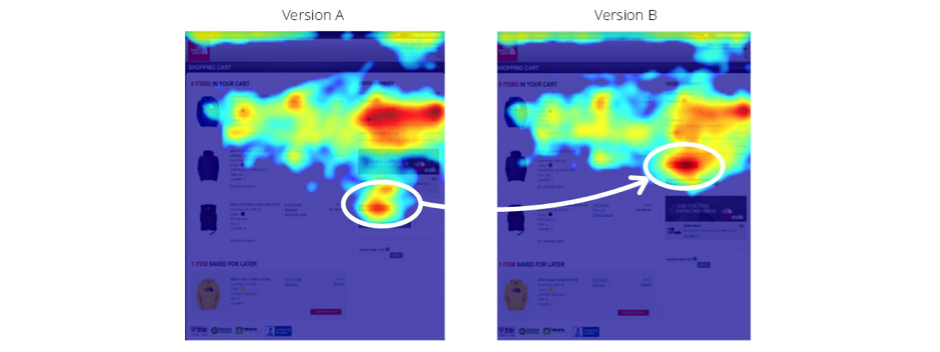
Click tracking heat map

Mouse-move heatmaps revealed that visitors interacted more with the checkout button when it was moved above the banner (B) with a 21% increase in clicks


Optimal Energy & UsabilityTools
Optimal Energy – one of the largest price comparison systems for energy distributors in Europe – had a big takeaway from a study with click tracking service UsabilityTools.
Optimal Energy’s website had a slider with images that appeared to be clickable CTAs, containing words like ‘Start’; these images were only samples, however, so they were not clickable.  Click tracking data showed that up to 24% of clicks on the website as a whole were on unclickable elements and about half of them on these false CTAs.
Click tracking tools will reveal where visitors are clicking. These "start buttons" aren't clickable.

Click tracking tools will reveal where visitors are clicking. These “start buttons” aren’t clickable.


In order to solve this problem, Optimal Energy immediately made these elements clickable, leading the user to a submission form. Thanks to this change, the effectiveness of CTAs increased by 66.2%, and the conversion rate increased by 122.6%.

Closing Thoughts

Click tracking provides actual, real data instead of relying on hunches or unfounded hypotheses.  The success of optimization projects on one website doesn’t necessarily generalize to other websites because every company has a unique set of clients, so you need study the behaviors of your clients to inform design changes.
In addition to ClickTale and UsabilityTools, other click tracking tools include Mouseflow, CrazyEgg, EyeQuant, and Inspectlet.
Sezgin Hergül is the marketing manager at UsabilityTools. He specializes in content marketing and website growth. Besides his love for marketing, he enjoys good design and music.
Image of mouse licensed through Creative Commons by Erin Kohlenberg & adapted for this post.

  • Author
  • Recent Posts
Sezgin Hergul
Sezgin Hergul
Sezgin Hergul
Latest posts by Sezgin Hergul (see all)
  • Use Data from Click Tracking Heat Maps to Increase Conversions - March 25, 2015
  • 0SHARES
March 25, 2015/by Sezgin Hergul
You might also like
5 SEO Insights Pivotal to Optimizing Your Website for Conversion
How to Create a Hypothesis List and Get a Date, Too
The Many Lessons of Heatmap Tests: For Further Study
9 Motivational CRO Lessons You Can Learn from Ghostbusters
Low Sales on Mobile, Conversion Tools, Flat Design [For Further Study]
Conversion Conference: One Conference that Should Pay for Itself Quickly
10 replies
  1. Maya Nix
    Maya Nix says:
    April 7, 2015 at 9:02 am

    Great post! I’d like to add that ClickTale’s Heatmaps aggregate thousands of clicks
    and that the next step is drilling down to individual session recordings that
    help you see the way the visitor interacted with the page. Many times the
    recordings clarify the results that you see on the Heatmaps and make you
    realize that certain webpage elements that you’ve taken for granted are
    actually unclear or even confusing to the visitor. With this clarity you can
    then optimize the webpage. Hope this helps!

    • Sezgin Hergul
      Sezgin Hergul says:
      April 8, 2015 at 5:13 am

      Hi Maya,
      Glad that you like the post. Thank you for the valuable insight!

  2. Kassandra Johanson
    Kassandra Johanson says:
    December 29, 2017 at 12:56 am

    Useful ideas ! For my two cents , if your company are searching for a service to merge PDF files , my secretary discovered a tool here https://goo.gl/Yh5spH.

Trackbacks & Pingbacks

  1. How to use heat maps to boost your website’s conversion potential - WebCorrectly says:
    March 30, 2017 at 2:00 pm

    […] to a case study of The North Face, a simple change of position for the checkout button can increase conversion drastically. The […]

  2. How to use heat maps to boost your website’s conversion potential – FlickMax says:
    March 29, 2017 at 2:20 pm

    […] to a case study of The North Face, a simple change of position for the checkout button can increase conversion drastically. The […]

  3. How to Get More Conversions Using Heatmaps - Social Marketing Fella says:
    April 5, 2016 at 3:48 pm

    […] a bid to increase their shopping cart conversion rate, North Face opted to use heatmaps after other tools at their disposal […]

  4. 8 Ways to Increase Conversion by Using Heat Maps says:
    February 8, 2016 at 11:37 pm

    […] Heat maps can be used to identify false CTAs – elements that appear to be clickable but aren’t. They can create frustrating user experience and impact conversion. Image source from Conversion Sciences. […]

  5. Understanding Simple Heat Maps for Smarter UI Design - Studio by UXPin says:
    September 15, 2015 at 10:15 am

    […] Source: Conversion Scientist […]

  6. Understanding Simple Heat Maps for Smarter UI Design - UXPin says:
    August 31, 2015 at 3:39 am

    […] Source: Conversion Scientist […]

  7. The Beginner’s Guide to Writing a Data-Driven Post says:
    April 30, 2015 at 10:01 am

    […] Another headline that tells the reader what to expect is this one from Conversion Scientist: […]

Comments are closed.

Search Search

Free Ad Alignment Report

Are your ads making promises that your landing pages aren't keeping. We'll pull your entire portfolio and grade the landing pages.

"*" indicates required fields

This field is hidden when viewing the form

Free for a limited time.

Conversion Optimization Course (FREE CRO Training)

Sign up and read the nine articles we will email you.

Latest Articles

  • CRO vs. AI. Who Wins? Images of Sahil Patel and Brian Massey Conversion Sciences LLC
    Your Traffic Fell 30 Percent. Your Targets Did Not.September 3, 2026 - 10:36 am
  • "The visitors that are eating your conversion rate" with bugs attacking the words "your conversion rate" Conversion Sciendes
    How to Filter Bot Traffic in Google Analytics With Ask AdvisorAugust 20, 2026 - 11:16 am
  • Brian Massey in a lab coat and a data monster in the background. The caption says "Talk to your analytics" Conversion Sciences LLC
    Using AI to Chat with your Online BusinessJuly 10, 2026 - 2:31 pm

Blog Article Categories

  • Advertising CRO
  • Artificial Intelligence
  • Conversion Marketing Strategy
  • Conversion Optimization
  • Conversion-Centered Design
  • CRO Tests | Multivariate | AB Testing
  • Ecommerce CRO
  • Landing Page Optimization
  • Lead Generation
  • Persuasion Science
  • Web Analytics
Conversion Sciences | Best Conversion Optimization Agency

FacebookTwitter/XPinterestLinkedInNews/RSS FeedPodcast

  • Conversion Optimization Services
    • Optimization Services
    • Guaranteed Redesign
    • Fully-managed CRO
    • CRO Audit
    • AI Optimization
    • CRO Training & Coaching
  • CRO Solutions
    • Conversion Solutions
    • eCommerce Optimization
    • Lead Generation Solutions
    • CRO for Website Redesign
    • CRO for Mobile Lead Gen
    • CRO for Advertising
  • About
    • About Conversion Sciences
    • Contact
    • Success Stories
    • CRO Resources
    • Blog
    • Your Customer Creation Equation Book
    • Free CRO Course
    • CRO Calculator
    • Press & Speaking Dates
Free — $10,000 Value

See Exactly Where Your Website Is Losing Revenue

In a free 30-minute session, a Senior Conversion Scientist will audit your site and deliver actionable recommendations.

🛡️ Backed by our Guaranteed ROI commitment — if we don't deliver results, you don't pay.
What you'll walk away with
✓

Personalized site audit of your highest-traffic pages with specific conversion gaps identified

✓

3–5 prioritized recommendations you can implement this week — whether or not you hire us

✓

Honest ROI assessment based on your traffic and conversion data

✓

1-on-1 with a Senior Conversion Scientist (avg. 8+ years CRO experience)

Intuit Boingo AMEX GBT + 300 more
Book your free session

"*" indicates required fields

You'll receive a calendar link within 1 business hour.
Free. No commitment. 30 minutes.

"At present, we see around 10X ROI. We're truly happy with what Conversion Sciences has brought." — StewMac

© Copyright 2007 - 2026 • Conversion Sciences • All Rights Reserved
Conversion Sciences® and Conversion Scientist® are
federally registered trademarks of Conversion Sciences LLC.
Any unauthorized use is expressly prohibited.
  • Privacy Policy
  • Terms of Service
  • Disclaimer
  • Cookie Policy
  • Security
  • Jobs
Link to: What if the Mobile Internet Wasn’t Important? [INFOGRAPHIC] Link to: What if the Mobile Internet Wasn’t Important? [INFOGRAPHIC] What if the Mobile Internet Wasn’t Important? [INFOGRAPHIC] Link to: Twins: Spotting Flaws in this Viral Split Test Link to: Twins: Spotting Flaws in this Viral Split Test Twins: Spotting Flaws in this Viral Split Test
Scroll to top Scroll to top Scroll to top