
A/B Testing Statistics: An Intuitive Guide For Non-Mathematicians
A/B testing statistics made simple. A guide that will clear up some of the more confusing concepts while providing you with a solid framework to A/B test effectively.
Here’s the deal. You simply cannot A/B test effectively without a sound understanding of A/B testing statistics. It’s true. Data integrity is the foundation of everything we do as a Conversion Rate Optimization Agency.
And while there has been a lot of exceptional content written on A/B testing statistics, I’ve found that most of these articles are either overly simplistic or they get very complex without anchoring each concept to a bigger picture.
Today, I’m going to explain the statistics of A/B testing within a linear, easy-to-follow narrative. It will cover everything you need to use A/B testing software effectively and it will make A/B Testing statistics simple.
Maybe you are currently using A/B testing software. And you might have been told that plugging a few numbers into a statistical significance calculator is enough to validate a test. Or perhaps you see the green “test is significant” checkmark popup on your testing dashboard and immediately begin preparing the success reports for your boss.
In other words, you might know just enough about split testing statistics to dupe yourself into making major errors, and that’s exactly what I’m hoping to save you from today. Whether you are executing a testing roadmap in house or utilizing in 3rd party conversion optimization services, you need to understand the statistics so you can trust the results.
Here’s my best attempt at making statistics intuitive.
Why Statistics Are So Important To A/B Testing
The first question that has to be asked is “Why are statistics important to A/B testing?”
The answer to that questions is that A/B testing is inherently a statistics-based process. The two are inseparable from each other.
An A/B test is an example of statistical hypothesis testing, a process whereby a hypothesis is made about the relationship between two data sets and those data sets are then compared against each other to determine if there is a statistically significant relationship or not.
To put this in more practical terms, a prediction is made that Page Variation #B will perform better than Page Variation #A. Then, data sets from both pages are observed and compared to determine if Page Variation #B is a statistically significant improvement over Page Variation #A.
This process is an example of statistical hypothesis testing.
But that’s not the whole story. The point of A/B testing has absolutely nothing to do with how variations #A or #B perform. We don’t care about that.
What we care about is how our page will ultimately perform with our entire audience.
And from this bird’s-eye view, the answer to our original question is that statistical analysis is our best tool for predicting outcomes we don’t know using information we do know. Statistical analysis, the science of using data to discover underlying patterns and trends, allows us to use data from user behaviors to optimize the page’s performance.
For example, we have no way of knowing with 100% accuracy how the next 100,000 people who visit our website will behave. That is information we cannot know today, and if we were to wait until those 100,000 people visited our site, it would be too late to optimize their experience.
What we can do is observe the next 1,000 people who visit our site and then use statistical analysis to predict how the following 99,000 will behave.
If we set things up properly, we can make that prediction with incredible accuracy, which allows us to optimize how we interact with those 99,000 visitors. This is why A/B testing can be so valuable to businesses.
In short, statistical analysis allows us to use information we know to predict outcomes we don’t know with a reasonable level of accuracy.
A/B Testing Statistics: The Complexities Of Sampling, Simplified
That seems fairly straightforward. So, where does it get complicated?
The complexities arise in all the ways a given “sample” can inaccurately represent the overall “population” and all the things we have to do to ensure that our sample can accurately represent the population.
Let’s define some terminology real quick.
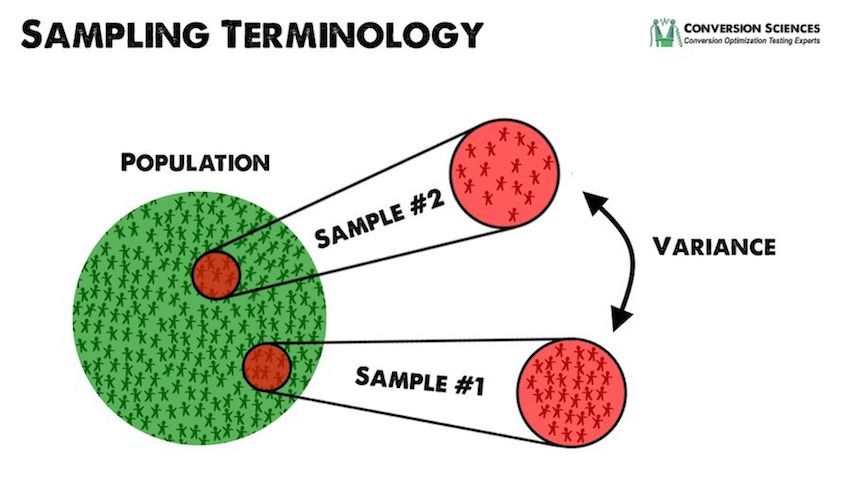
The “population” is the group we want information about. It’s the next 100,000 visitors in my previous example. When we’re testing a webpage, the true population is every future individual who will visit that page.
The “sample” is a small portion of the larger population. It’s the first 1,000 visitors we observe in my previous example.
In a perfect world, the sample would be 100% representative of the overall population. For example:
Let’s say 10,000 out of those 100,000 visitors are going to ultimately convert into sales. Our true conversion rate would then be 10%.
In a tester’s perfect world, the mean (average) conversion rate of any sample(s) we select from the population would always be identical to the population’s true conversion rate. In other words, if you selected a sample of 10 visitors, one of them (or 10%) would buy, and if you selected a sample of 100 visitors, then 10 would buy.
But that’s not how things work in real life.
In real life, you might have only two out of the first 100 buy or you might have 20… or even zero. You could have a single purchase from Monday through Friday and then 30 on Saturday.
The Concept of Variance
This variability across samples is expressed as a unit called the “variance,” which measures how far a random sample can differ from the true mean (average).
The Freakonomics podcast makes an excellent point about what “random” really is. If you have one person flip a coin 100 times, you would have a random list of heads or tails with a high variance.
If we write these results down, we would expect to see several examples of long streaks — five or seven or even ten heads in a row. When we think of randomness, we imagine that these streaks would be rare. Statistically, they are quite possible in such a dataset with high variance.
The higher the variance, the more variable the mean will be across samples. Variance is, in some ways, the reason statistical analysis isn’t a simple process. It’s the reason I need to write an article like this in the first place.
So it would not be impossible to take a sample of ten results that contain one of these streaks. This would certainly not be representative of the entire 100 flips of the coin, however.
Regression toward the mean
Fortunately, we have a phenomenon that helps us account for variance: “regression toward the mean.”
Regression toward the mean is “the phenomenon that if a variable is extreme on its first measurement, it will tend to be closer to the average on its second measurement.”
Ultimately, this ensures that as we continue increasing the sample size and the length of observation, the mean of our observations will get closer and closer to the true mean of the population.
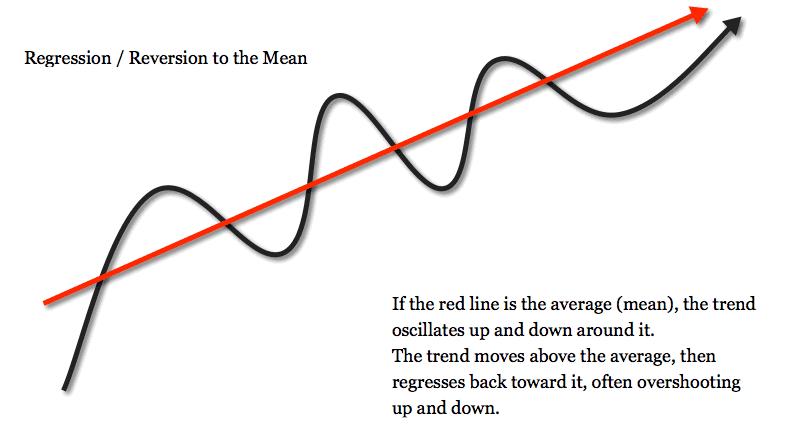
In other words, if we test a big enough sample for a sufficient length of time, we will get accurate “enough” results.
So what do I mean by accurate “enough”?
Understanding Confidence Intervals & Margin of Error
In order to compare two pages against each other in an A/B test, we have to first collect data on each page individually.
Typically, whatever A/B testing tool you are using will automatically handle this for you, but there are some important details that can affect how you interpret results, and this is the foundation of statistical hypothesis testing, so I want to go ahead and cover this part of the process.
Let’s say you test your original page with 3,662 visitors and get 378 conversions. What is the conversion rate?
You are probably tempted to say 10.3% (dividing 378 by 3,662), but that’s inaccurate. 10.3% is simply the mean of our sample. There’s a lot more to the story.
To understand the full story, we need to understand two key terms:
- Confidence Interval
- Margin of Error
You may have seen something like this before in your split testing dashboard.

The original page above has a conversion rate of 10.3% plus or minus 1.0%. The 10.3% conversion rate value is the mean. The ± 1.0 % is the margin for error, and this gives us a confidence interval spanning from 9.3% to 11.3%.
10.3% ± 1.0 % at 95% confidence is our actual conversion rate for this page.
What we are saying here is that we are 95% confident that the true mean of this page is between 9.3% and 11.3%. From another angle, we are saying that if we were to take 20 total samples, we can know with complete certainty that the 19 of those samples would contain the true conversion rate within their confidence intervals.
The confidence interval is an observed range in which a given percentage of test outcomes fall. We manually select our desired confidence level at the beginning of our test, and the size of the sample we need is based on our desired confidence level.
The range of our confidence level is then calculated using the mean and the margin of error.
The easiest way to demonstrate this with a visual.

Confidence interval example.
The confidence level is decided upon ahead of time and based on direct observation. There is no prediction involved. In the above example, we are saying that 19 out of every 20 samples tested WILL, with 100% certainty, have an observed mean between 9.3% and 11.3%.
The upper bound of the confidence interval is found by adding the margin of error to the mean. The lower bound is found by subtracting the margin of error from the mean.
The margin for error is a function of the standard deviation, which is a function of the variance. Really all you need to know is that all of these terms are measures of variability across samples.
Confidence levels are often confused with significance levels (which we’ll discuss in the next section) since optimizers often set the significance level to align with the confidence level, usually 95%.
You can set the confidence level to whatever you like. If you want 99% certainty, you can achieve it, BUT it will require a significantly larger sample size. As the chart below demonstrates, diminishing returns make 99% impractical for most marketers, and 95% or even 90% is often used instead for a cost-efficient level of accuracy.

In high-stakes scenarios (lifesaving medicine, for example), testers will often use 99% confidence intervals, but for the purposes of the typical CRO specialist, 95% is almost always sufficient.
Advanced testing tools will use this process to measure the sample conversion rate for both the original page AND Variation B, so it’s not something you’ll ever have to calculate on your own, but this is how our process starts, and as we’ll see in a bit, it can impact how we compare the performance of our pages.
Once we have our conversion rates for both the pages we are testing against each other, we use statistical hypothesis testing to compare these pages and determine whether the difference is statistically significant.
Important Note About Confidence Intervals
It’s important to understand the confidence levels your A/B testing tools are using and to keep an eye on the confidence intervals of your pages’ conversion rates.
If the confidence intervals of your original page and Variation B overlap, you need to keep testing even if your testing tool is saying that one is a statistically significant winner. This is easier to understand if you look at the probability curves of the two variables.

With a 1.5% higher conversion rate, these Binomial distributions overlap one another.
In this illustration, both variations received 10,000 visits. The p-value of the control (red) is 0.45. The p-value of the test (blue) is 0.465. While B has a 1.5% higher conversion rate, the two graphs overlap significantly. This visually shows there isn’t enough evidence to call B a winner. It doesn’t have statistical significance yet.
Significance, Errors, & How To Achieve The Former While Avoiding The Latter
Remember, our goal here isn’t to identify the true conversion rate of our population. That’s impossible.
When running an A/B test, we are making a hypothesis that Variation B will convert at a higher rate for our overall population than Variation A will. Instead of displaying both pages to all 100,000 visitors, we display them to a sample instead and observe what happens.
- If Variation A (the original) had a better conversion rate with our sample of visitors, then no further actions need to be taken as Variation A is already our permanent page.
- If Variation B had a better conversion rate, then we need determine whether the improvement was statistically large “enough” for us to conclude that the change would be reflected in the larger population and thus warrant us changing our page to Variation B.
So why can’t we take the results at face value?
The answer is variability across samples. Thanks to the variance, there are a number of things that can happen when we run our A/B test.
- Test says Variation B is better & Variation B is actually better
- Test says Variation B is better & Variation B is not actually better (type I error)
- Test says Variation B is not better & Variation B is actually better (type II error)
- Test says Variation B is not better & Variation B is not actually better
As you can see, there are two different types of errors that can occur. In examining how we avoid these errors, we will simultaneously examine how we run a successful A/B test.
Before we continue, I need to quickly explain a concept called the null hypothesis.
The null hypothesis is a baseline assumption that there is no relationship between two data sets. When a statistical hypothesis test is run, the results either disprove the null hypothesis or they fail to disprove the null hypothesis.
This concept is similar to “innocent until proven guilty”: A defendant’s innocence is legally supposed to be the underlying assumption unless proven otherwise.
For the purposes of our A/B test, it means that we automatically assume Variation B is NOT a meaningful improvement over Variation A. That is our null hypothesis. Either we disprove it by showing that Variation B’s conversion rate is a statistically significant improvement over Variation A, or we fail to disprove it.
And speaking of statistical significance…
Type I Errors & Statistical Significance
A type I error occurs when we incorrectly reject the null hypothesis.
To put this in A/B testing terms, a type I error would occur if we concluded that Variation B was “better” than Variation A when it actually was not.
Remember that by “better,” we aren’t talking about the sample. The point of testing our samples is to predict how a new page variation will perform with the overall population. Variation B may have a higher conversion rate than Variation A within our sample, but we don’t truly care about the sample results. We care about whether or not those results allow us to predict overall population behavior with a reasonable level of accuracy.
So let’s say that Variation B performs better in our sample. How do we know whether that improvement will translate to the overall population? How do we avoid making a type I error?
Statistical significance.
Statistical significance is attained when the p-value is less than the significance level. And that is way too many new words in one sentence, so let’s break down these terms and then we’ll summarize the entire concept in plain English.
The p-value, or probability value, tells you the odds of obtaining A/B test results at least as extreme as the result actually observed in your test. A p-value of 0.05 or less means an extreme outcome would be unlikely if the null hypothesis is true.
In other words, the p-value is the expected fluctuation in a given sample, similar to the variance. Imagine running an A/A test, where you displayed your page to 1,000 people and then displayed the exact same page to another 1,000 people.
You wouldn’t expect the sample conversion rates to be identical. We know there will be variability across samples. But you also wouldn’t expect it be drastically higher or lower. There is a range of variability that you would expect to see across samples, and that, in essence, is our p-value.
The significance level is the probability of rejecting the null hypothesis given that it is true.
Essentially, the significance level is a value we set based on the level of accuracy we deem acceptable. The industry standard significance level is 5%, which means we are seeking results with 95% accuracy.
So, to answer our original question:
We achieve statistical significance in our test when we can say with 95% certainty that the increase in Variation B’s conversion rate falls outside the expected range of sample variability.
Or from another way of looking at it, we are using statistical inference to determine that if we were to display Variation A to 20 different samples, at least 19 of them would convert at lower rates than Variation B.
Type II Errors & Statistical Power
A type II error occurs when the null hypothesis is false, but we incorrectly fail to reject it.
To put this in A/B testing terms, a type II error would occur if we concluded that Variation B was not “better” than Variation A when it actually was better.
Just as type I errors are related to statistical significance, type II errors are related to statistical power, which is the probability that a test correctly rejects the null hypothesis.
For our purposes as split testers, the main takeaway is that larger sample sizes over longer testing periods equal more accurate tests. Or as Ton Wesseling of Testing.Agency says here:
“You want to test as long as possible — at least one purchase cycle — the more data, the higher the Statistical Power of your test! More traffic means you have a higher chance of recognizing your winner on the significance level you’re testing on!
Because…small changes can make a big impact, but big impacts don’t happen too often – most of the times, your variation is slightly better – so you need much data to be able to notice a significant winner.”
Statistical significance is typically the primary concern for A/B testers, but it’s important to understand that tests will oscillate between being significant and not significant over the course of a test. This is why it’s important to have a sufficiently large sample size and to test over a set time period that accounts for the full spectrum of population variability.
For example, if you are testing a business that has noticeable changes in visitor behavior on the 1st and 15th of the month, you need to run your test for at least a full calendar month. This is your best defense against one of the most common mistakes in A/B testing… getting seduced by the novelty effect.
Peter Borden explains the novelty effect in this post:
“Sometimes there’s a “novelty effect” at work. Any change you make to your website will cause your existing user base to pay more attention. Changing that big call-to-action button on your site from green to orange will make returning visitors more likely to see it, if only because they had tuned it out previously. Any change helps to disrupt the banner blindness they’ve developed and should move the needle, if only temporarily.
More likely is that your results were false positives in the first place. This usually happens because someone runs a one-tailed test that ends up being overpowered. The testing tool eventually flags the results as passing their minimum significance level. A big green button appears: “Ding ding! We have a winner!” And the marketer turns the test off, never realizing that the promised uplift was a mirage.”
By testing a large sample size that runs long enough to account for time-based variability, you can avoid falling victim to the novelty effect.
Important Note About Statistical Significance
It’s important to note that whether we are talking about the sample size or the length of time a test is run, the parameters for the test MUST be decided on in advance.
Statistical significance cannot be used as a stopping point or, as Evan Miller details, your results will be meaningless.
As Peter alludes to above, many A/B testing tools will notify you when a test’s results become statistical significance. Ignore this. Your results will often oscillate between being statistically significant and not being statistically significant.

Statistical significance. Source: Optimizely.
The only point at which you should evaluate significance is the endpoint that you predetermined for your test.
Terminology Cheat Sheet
We’ve covered quite a bit today.
For those of you who have just been smiling and nodding whenever statistics are brought up, I hope this guide has cleared up some of the more confusing concepts while providing you with a solid framework from which to pursue deeper understanding.
If you’re anything like me, reading through it once won’t be enough, so I’ve gone ahead and put together a terminology cheat sheet that you can grab. It lists concise definitions for all the statistics terms and concepts we covered in this article.

Joel has grown/optimized revenue, profit, teams and operations for numerous internet companies.
Expertise: executive leadership, business development, digital marketing, team building, conversion optimization, performance marketing, video
Speaking: CXL Live, Conversion Conference, Content Jam, and more
As Seen On: Unbounce, VWO, Search Engine Land, CXL, KlientBoost, and more
Education: The University of New Mexico, BA Sociology and Business. and UNM Anderson School of Management, MBA Marketing, Entrepreneurship
- A/B Testing Statistics: An Intuitive Guide For Non-Mathematicians - September 8, 2016


The “endpoint you predetermined” – – are you referring to effect size or…
Hey Andrew, no that is in reference to time. Statistical significance should be evaluated at a predetermined end date that allows for a full cycle of customer behavior. One month is a good baseline.
Hey Jacob,
A rarely good article, indeed! Statistical power is so often overlooked in A/B tests, that it’s nice to see it mentioned and in detail, too!
The assumption of having a fixed sample size (as also discussed in other comments) is what makes robust application of the statistical tools especially hard to apply in A/B testing practice.
I mean, everyone wants to end a test as quickly as possible, either to reap the benefits or cut the loses, but the statistical method does not allow for sequential evaluation of the data. Right? Not exactly – the method has been modified to fit the use case of medical testing, which in fact is no different than the one in online marketing and UX. If a robust solution for statistical design and sequential evaluation of A/B tests that allows you to run tests 20-80% faster would be interesting for you, I’d suggest you look into the AGILE A/B Testing statistical approach.
A free white paper detailing it is available here: https://www.analytics-toolkit.com/whitepapers.php?paper=efficient-ab-testing-in-cro-agile-statistical-method .
Best,
Georgi
There is no such thing as bad data!
You’re going to have to say more about that…
Theres a such thing as incomplete data which makes it useless for scientific inquiry
The truth is, David, that ALL data is incomplete. But there is no good argument that it is all useless for scientific inquiry. The more you have the better your decisions.
You got the confidence intervals wrong!
“From another angle, we are saying that if we were to take 20 total samples, we can know with complete certainty that the sample conversion rate would fall between 9.3% and 11.3% in at least 19 of those samples.”
You can only say that in 19 out of the 20 samples, their corresponding confidence intervals will contain the true conversion rate. Your interval endpoints, 9.3% and 11.3%, are simply random draws here. You can’t put them in direct relation with the population conversion rate as you did here.
Anton, I believe you are correct. I’ve updated the article. I hope this doesn’t obscure the point, but it is statistics. Thanks for pointing this out.
Thanks for explaining it in a way that non-mathematicians can actually understand. I’ve started AB testing in mailings recently and couldn’t quite interpret the data correctly. I also ended my tests too soon, eliminating the possibility of having decent statistics… This made some things clearer and I look forward to learning more!