audio available

Technically, a “bounce” is a visitor that looks at only one page, or a visitor that spends an embarrassingly short time on the page. Keep reading to find out how to reduce bounce rates.

A bounce is any visit for which the visitor only looks at one page and does not interact with it. This sounds truly unfair as someone may spend minutes on your blog post or landing page, and still be counted as a bounce.

A visitor bounces when they don’t find anything close to what they were looking for when they visit your site. Either you’re attracting the wrong visitors or you don’t know why they are visiting.

Bounce is the most extreme form of conversion problem. High bounce rates are an indication that you are throwing good marketing dollars down the tubes. Whatever you’re spending to get traffic to your site is being wasted.

How to Reduce Bounce Rates or the heartbreak of “bounce”

Boing!

That’s the sound of someone finding your site, but not finding what they wanted ON your site.

Boing!

That’s the sound of website content that doesn’t match your marketing.

Boing!

That’s the sound of a website that talks about the company instead of the visitors’ problems.

High bounce rates are an indication that you are throwing good marketing dollars down the tubes. Whatever you’re spending to get traffic to your site is being wasted. Discover Keep how to reduce bounce rates.

Bounces Aren’t Helpful to Businesses

What are some strategies to reduce bounce rate?

This is a common question, and requires an understanding of the definitions of bounce rate.

The bounce rate is a bit slippery and requires some examination. The intention of measuring the bounce rate is to figure out how many of your visitors are leaving almost immediately after arriving at your site. This metric provides for a lot of error in interpretation.

“A high bounce rate means your site is crappy.”

This is rarely the case. A more accurate explanation is that your site doesn’t look the way your visitors expect it to look. Understanding what your visitors expect is the way to reduce bounce rates.

Instead, there are usually some more valid reasons for your high bounce rate. Here are the things digital marketing and conversion experts examine when confronted with uncomfortably high bounce rates.

1. You’re measuring it wrong

How you measure your bounce rate can give you very different insights. For example, blogs often have high bounce rates. Does this mean that visitors don’t like the blog?

Many analytics packages measure a bounce as a visit, or session, that includes only one page on your site. Visitors who take the time to read an entire article would be considered a “bounce” if they then left, even though they are clearly engaged.

We set a timer for our blog traffic, so that any visitor who sticks around for 15 seconds or more is not considered a bounce. You can set a timer to the amount of time you consider appropriate.

2. How to Reduce Bounce Rates: Diagnose Technical Difficulties

We are fond of saying that you don’t have one website, you have ten or twenty or thirty. Each device, each browser, each screen-size delivers a different experience to the visitor. If your website is broken on one of the devices popular with your visitors, you will see a bump in overall bounce rate.

If your pages load slowly, especially on mobile devices, you can expect a higher bounce rate.

Broken internal links and 404 pages are also cause for bounce.

If your page breaks out in a chorus of Also Sprach Zarathustra when the page loads, you may enjoy a higher bounce rate.

How to diagnose device-related technical problems

Your analytics package will track the kind of device your visitors are coming on.

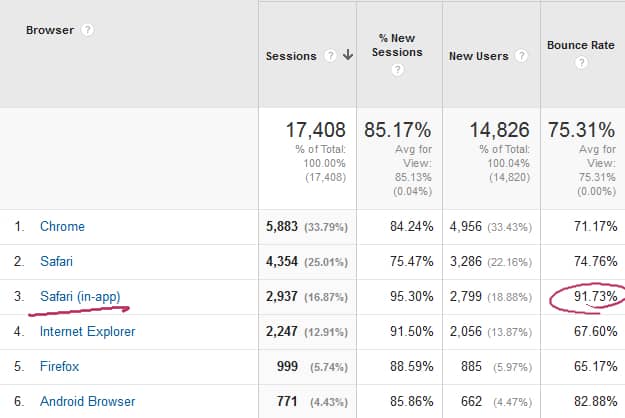
Is there a problem with this site when viewed with the Safari (in app) browser?

Is there a problem with this site when viewed with the Safari (in app) browser?

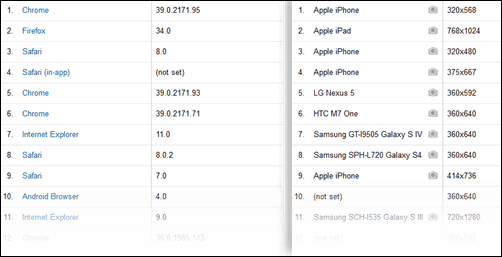
The Google Analytics report Audience > Technology > Browser & OS shows that there may be a technical issue with Safari visitors coming from within an app. This may also reflect visitors coming from mobile ads, and they may simply be lower quality. See below.

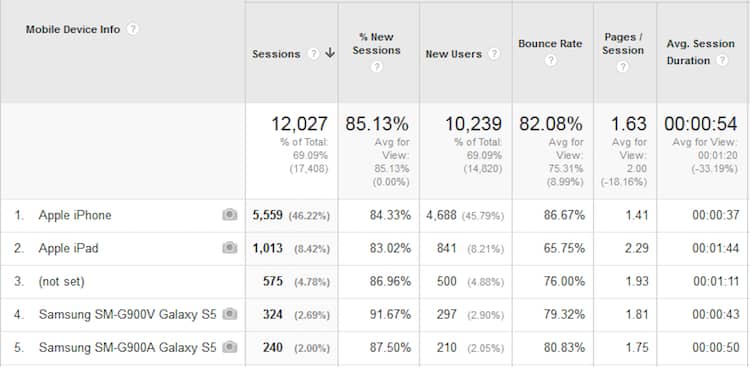
With Google Analytics Audience > Mobile > Devices report, we see mobile devices specifically. The Apple iPhone has an above-average bounce rate, and we should probably do some testing there, especially since it’s the bulk of our mobile traffic.

With an above average bounce rate, visitors on an Apple iPhone may be seeing a technical problem.

With an above average bounce rate, visitors on an Apple iPhone may be seeing a technical problem.

3. Good Traffic Quality Helps Reduce Bounce Rates

If you are getting the wrong visitors, you will have a high bounce rate.

Remember StumbleUpon? Getting your site featured on the internet discovery site often meant a flood of new visitors to your site… and a crash in your conversion rate. Stumble traffic was not qualified, they were just curious.

Your bounce rate is a great measure of the quality of your traffic. Low quality traffic bounces because:

  • The search engine showed them the wrong link or a broken link. Do you know how many visitors used to come to our site looking for a “conversion rate” for Russian Rubles to Malaysian Ringletts?!
  • User intent. The visitors aren’t ready to buy. They were in a different part of the purchase process. Visitors coming from Social Media ads have notoriously low conversion rates. They weren’t looking, they were just surfing your product pages.

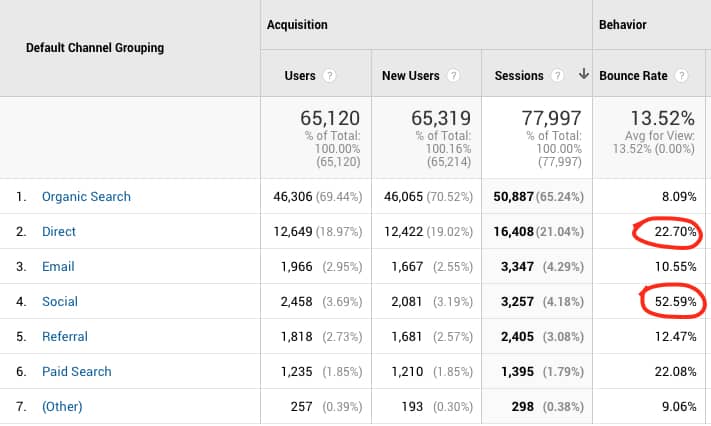
We take a closer look at the source of traffic to diagnose a traffic quality problem using Google Analytics Acquisition > All Traffic > Channels report.

Direct is one of our biggest traffic sources and brings in one of the two highest bounce rates.

Direct is one of our biggest traffic sources and brings in one of the two highest bounce rates.

Here we can see that traffic coming from social media and those visitors coming “Direct-ly” have a high bounce rate.

If you are driving a lot of visitors to your home page, you may want to consider presenting them with links to more relevant content. As Tim Ash says, “The job of the home page is to get people off of the home page.” He didn’t mean by bouncing.

With regard to social media, we may have a problem with broken promises.

4. Broken Promises Lead to Conversion Problems

Do your entry pages consider the source of visits?

If your traffic is clicking on an ad that promises 20% off on a specific propane grill, and they’re directed to your home page, you’ve broken a promise.

You might think that they will search your site for the deal. You might even think they’ll search your home page for the deal. You’re wrong. Many will jump.

Every ad, every email invitation, every referral link is a promise you make to your visitor. If they don’t come to a page that lives up to the promise, they are likely to bounce.

  • Does the headline on the page match the offer in the ad?
  • Does the product in the email appear after the click?
  • Are your calls to action in alignment with the landing page?
  • Are the colors and design consistent across media?
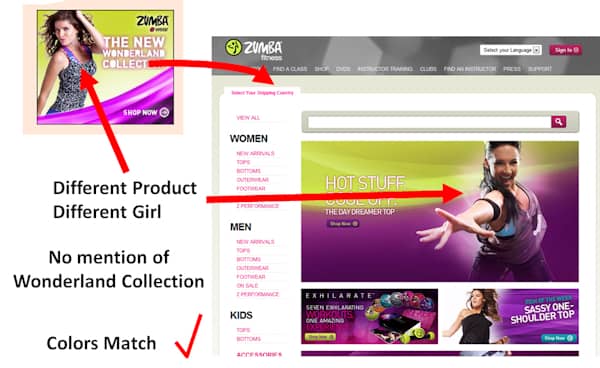
This Ad takes the visitors to a page that is almost designed to disappoint.

This Ad takes the visitors to a page that is almost designed to disappoint.

Looking at your ads on a page-by-page basis is necessary to diagnose and correct this kind of bounce rate problem.

5. Vague Value Propositions don’t help reduce bounce rates

Ultimately, if you’re not communicating your value proposition to your visitors clearly, you are going to enjoy a monstrous bounce rate.


21 Quick and Easy CRO Copywriting Hacks to Skyrocket Conversions

21 Quick and Easy CRO Copywriting Hacks

Keep these proven copywriting hacks in mind to make your copy convert.

  • 43 Pages with Examples
  • Assumptive Phrasing
  • "We" vs. "You"
  • Pattern Interrupts
  • The Power of Three

"*" indicates required fields

This field is for validation purposes and should be left unchanged.


Your value proposition typically does not address your company or your products. It should be targeted at your visitor, why they are there, and why they should stick around.

Each page has its own value proposition. Your business may have a powerful value proposition, but each page should stand on its own.

A contact page should talk about what will happen after you complete the form. Who will contact you? How long will it take? Will they try to sell you something?

A landing page should clearly state that you are in the right place and provide reasons for you to stay and read on.

Reduce bounce rates: This landing page delivered a strong value proposition in above the fold. See the full case study and video.

This landing page delivered a strong value proposition in above the fold. See the full case study and video.

A home page should help you find your way into the site. Most home pages are treated like highway billboards. No wonder people just drive on by.

6. Finally, Is Your Stubborn Bounce Rate Mocking You? [AUDIO]

Most of us, at one time or another, have not only been frustrated with our bounce rate, but completely puzzled about what to do about it.

In this podcast, I will guide you toward a more accurate bounce rate. I will walk you through the steps to use The Timer Listener to time the visit duration of each of your visitors and get those percentages down where they belong.

Conversion-Scientist-Podcast-Logo-1400x1400


Subscribe to Podcast

Ultimately, we don’t want to reduce our bounce rate. We want to improve our conversion rate by bringing the right traffic, to the right page, with the right message, and avoid technical issues that get in the way.

Richard Strauss: Also Sprach Zarathustra by Kevin MacLeod is licensed under a Creative Commons Attribution License.

Brian Massey Marketing Land article, Using A Google Tag Manager Listener To Get Your Real Bounce Rate


Brian Massey, the Conversion Scientist™, shares how to combine data from video hosting services with Google Analytics to measure video impact on your revenue and conversions.

In this episode of The Conversion Scientist Podcast, Brian Massey tells you how to gain insights from third-party tools in Google Analytics. He uses several video hosts as an example to show step by step how to integrate these “In-App” video metrics with Analytics. And how to use Google Analytics to measure the impact of video content on your revenue.

Remember to check the very last section of this article to watch the free eight-part bit-sized video mini-course, “Video that Converts”

When “In-App” Analytics Are Not Enough to Gauge Impact on Conversions and Revenue

We were working on a client that sells a software application. After completing a test, we identified a single change that could increase the number of demo requests by 29%.

What was the change that would cause such a dramatic lift in conversion rate?

We removed a video from their demo request page.

Why? A quick look at the analytics showed that only few visitors were watching the video. We had a hunch that it was probably a barrier to conversions. And it was blocking more important information — information that could persuade more visitors to fill out the form on the page.

Video is just one of the many third-party services commonly implemented on ecommerce websites. Others include exit-intent overlays, live chat, ratings and reviews, faceted search or personalized and predictive product recommendations services.

The vast majority of third-party services will offer “in-app” analytics to help you assess their impact on your visitors’ behavior. Even though these “In App” analytics can provide insight into your online customers, they cannot show you the tools’ impact on leads and sales.

Integration with primary analytics tools, such as Google Analytics, is a must when identifying opportunities to optimize.

Using Google Analytics to Measure the Impact of Video on Revenue

Now, let’s take a deeper look at how integration of third-party analytics with Google Analytics can help answer difficult questions about our video ROI.

In-App Analytics

The vast majority of third-party tools offer useful analytics.

Let’s consider video hosts first. These services host your marketing videos and allow you to embed them on your site, landing pages and/or social media channels. Their promise is simple: faster, more reliable streaming than your basic website servers. Plus in-app video analytics.

We have used a variety of these providers in our video conversion projects, such as YouTube, Vimeo, Ooyala, Wistia and Vidyard. While YouTube is free, it gives your visitors too many opportunities to leave the webpage. The rest require a monthly video hosting fee.

All of these services offer some kind of dashboard with basic in-app analytics. Some of the metrics they share are:

  • Number of times a video is loaded
  • Number of times a video is played
  • Percentage of visitors who clicked Play
  • Average percentage of video watched
  • Geo distribution of your video audience

A Wistia Analytics Example

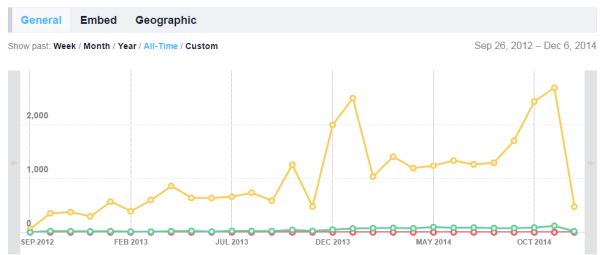
We can see on the Vimeo graph below, the load counts, play counts and social sharing counts for this particular video.

Vimeo offers load counts, play counts and social sharing counts. The graph shows how many visitors saw the video, how many watched and how many shared it.

The graph shows how many visitors saw the video, how many watched and how many shared it.

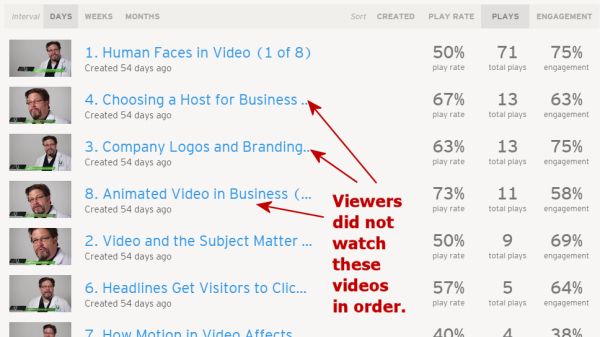
More interestingly, the Wistia report below, on an eight-part video series shows that viewers did not watch them in order. And we can deduce which of the topics captured our visitor’s interest.

Audience Retention Analysis: Vidyard and YouTube Examples

Wistia in-app analytics allows you to compare plays and play rates for multiple videos in a series.

Wistia in-app analytics allows you to compare plays and play rates for multiple videos in a series.

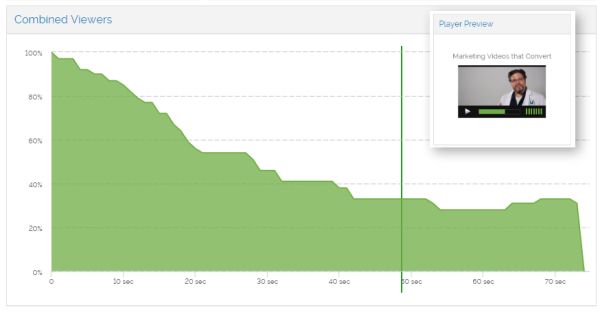
If you are interested in finding which part of a video is less interesting to your video viewers, Vidyard and YouTube have a viewer drop-off graph. You may use it to gather how many stick around until the end.

Almost half of my viewers drop-off within 20 seconds.

In this Vidyard chart we can see that almost half of my viewers dropped off within 20 seconds. This video needs a stronger intro.

The results can be quite informative.

Consider this audience retention graph from a YouTube account. See the pronounced viewer drop-off in the first few seconds? Something made more than 10% of video viewers leave within seconds of starting the video. What could it be?

Something made over 10% of visitors leave within seconds of pressing play on the video.

YouTube audience retention graph.

This audience retention visual report can be found inside your YouTube channel, synced with the video you are analyzing.

Our hypothesis was that viewers lost interest due to a vanity logo sequence. And it was costing us viewers.

We picked another video without vanity intro and we noticed a much smaller initial drop-off at the beginning. This supported our hypothesis.

Notice that there is a slight lift at the beginning of the video that has no branded intro.

The YouTube chart for the video without a vanity intro shows a slight engagement lift at the very beginning.

Vanity, thy name is logo. Even we at Conversion Sciences have given in to our egos with similarly unpleasant results.

Our vanity video intro definitely chased viewers away.

We were chasing our viewers away.

It goes without saying that we no longer use the cool branding sequence in our marketing videos.

Measuring the Impact of Video on your Bottom Line: Integrated Analytics

The biggest barrier in-app analytics have is that they cannot be linked to our revenue metrics, namely leads and sales.

Predictive metrics like Engagement or Attention are not definitive. They can only suggest what might happen.

And as we have said again and again, increasing engagement may actually decrease conversion.

These are the questions we need answered by our analytics:

  • Do those customers who view the video buy more often?
  • Are they more likely to complete a lead form?
  • Are they buying more or less?
  • Does their buying behavior change if they only watch part of a video? If so, how?
  • Which videos generate more sales than others?

Time to bring in this third-party vendor data and integrated with Google Analytics.

The good news is, most of these third-party platforms or applications provide a way to generate Google Analytics events on visitor interaction. Events like watching a video, performing a filtered search or starting a live chat.

Integrating Google Analytics could be as simple as entering your Google Analytics ID, enabling a Google Tag Manager pre-written tag or adding some Javascript tracking code to your page.

Integrate Google Analytics to Measure the Impact of Video on Conversions

Video platforms generally fire Events when somebody plays the video, for the duration of the play and when the video has been watched to completion. Therefore, we don’t have much control over the type of Events the video platform provides.

Nevertheless, this is usually enough for us to create some advanced segments and assess the impact of the video on our sales or lead conversions.

We tested both Wistia and Vidyard in-app analytics integrated with Google Analytics on our eight-part video mini-course.

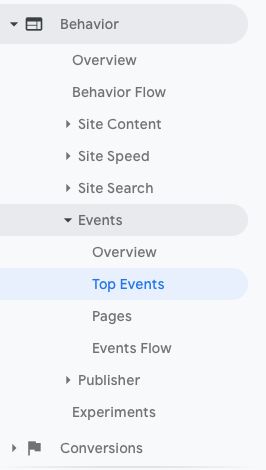
To see the Events generated by either of the embedded video players, choose Behavior > Events in Google Analytics.

Google Analytics Events: Integrate Google Analytics to Measure the Impact of Video on Conversions.

Google Analytics Events menu.

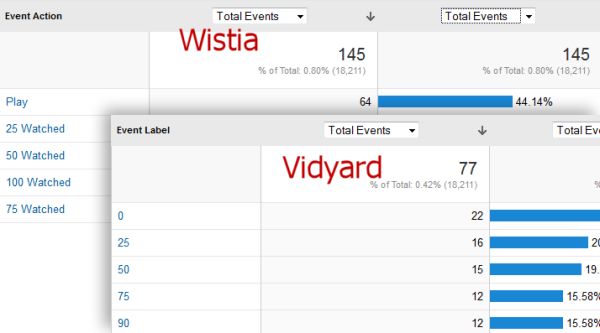
Here you will be able to see which Events are being generated by either of the video platforms. In this case, both send us Events when a video was played and for how long.

A screenshot of the Events sent by Wistia and Vidyard to Google Analytics.

A screenshot of the Events sent by Wistia and Vidyard to Google Analytics.

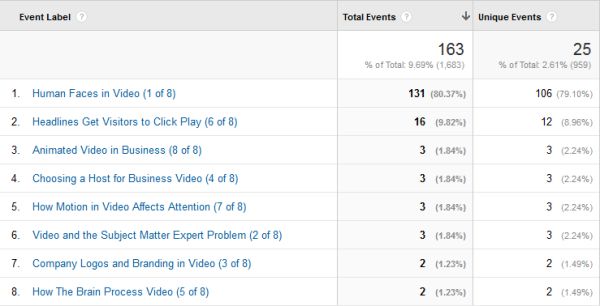
Now, switch from Event Action to Event Label as the Primary Dimension on your Google Analytics report to see which videos are being watched.

Both video platforms set events sharing which videos get played.

Both video analytics are sending the videos that are being viewed.

But all of the above data can be found within the respective tools’ dashboards. Let’s dive into more interesting information by creating Advanced Segments.

Creating a GA Advanced Segment with Wistia’s Events

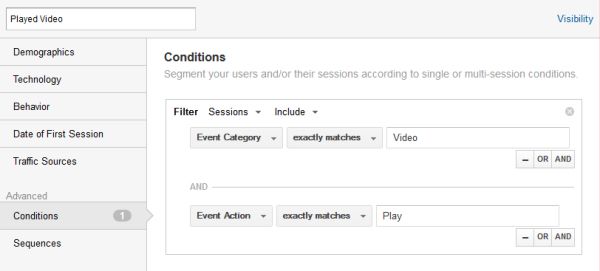
To measure and isolate sessions in which the visitor played a video, we built an Advanced Segment in Google Analytics. This is particularly useful for online shops. It allows us to find out the impact of these videos on customer’s purchasing habits.

We used Wistia’s Play Event to isolate those sessions in which any of the eight videos in our series was viewed.

By creating an Advanced Segment in Google Analytics, we can look at sessions that include visitors who watched a video.

By creating an Advanced Segment in Google Analytics, we can look at sessions that include visitors who watched a video.

Our Wistia’s Played Video Advanced Segment includes sessions where a visitor played a video.

Use this segment to filter your ecommerce site Revenue, Conversion and Transaction data. Identify those visitors who watched one or more videos. Now, discover if this affected their buying behavior.

Advanced Segments reports in Google Analytics to measure the impact of video on revenue and conversions for a fictitious ecommerce site. Comparing a buyer who interacted with a video to the “average” site visitor, we observe a drop in conversion rate and average order value.

Comparing a buyer who interacted with a video to the “average” site visitor, we observe a drop in conversion rate and average order value.

In this example, the report strongly implies that website buyers who watched the video were less likely to make a purchase and bought less.

A simple integration of you video platform’s data with Google Analytics can derive stronger insights to find out the true impact of video on your bottom-line. Which ones will you find in your analytics now? Is your third-party app helping or hindering your sales or leads?

For more on Google Analytics to Measure the Impact of Video on Your Revenue, Listen to the Podcast

In this episode of The Conversion Scientist Podcast, Brian Massey tells you how to gain insights from third-party tools in Google Analytics. He uses several video hosts as an example.

Conversion-Scientist-Podcast-Logo-1400x1400


Subscribe to Podcast

Link to Article on Marketing Land

Watch the free eight-part bit-sized video mini-course

Since you are a student of our Conversion Course, you get the entire mini-course Video that Converts.

An important eight-part series on creating marketing videos that convert visitors to leads and sales from Conversion Sciences.

  1. How Faces Influence Video Marketing
  2. Using Video to Solve the Subject Matter Expert Problem
  3. How Marketing Videos Chase Viewers Away in the First Seconds
  4. Video Hosting-Why Youtube is the Wrong Choice
  5. How the Brain Processes Video
  6. Headlines that Get Visitors to Click Play
  7. How Motion in Marketing Videos Affects Viewer Attention
  8. Video Marketing Using Animation

Special thanks to Vidpow for producing the videos in our Video that Converts Mini-course.


21 Quick and Easy CRO Copywriting Hacks to Skyrocket Conversions

21 Quick and Easy CRO Copywriting Hacks

Keep these proven copywriting hacks in mind to make your copy convert.

  • 43 Pages with Examples
  • Assumptive Phrasing
  • "We" vs. "You"
  • Pattern Interrupts
  • The Power of Three

"*" indicates required fields

This field is for validation purposes and should be left unchanged.


How many goals do you set when you’re designing a split test for your website?

We’re goal-crazy here in the lab at Conversion Sciences. It is not unusual for our tests have dozens of goals. Why is that?

We see split testing as a data collection activity, not a tool that gives us answers. It’s not like wikipedia. The split-testing software on the market to day is amazingly agile when it comes to tracking, targeting and snooping on visitor behavior. We certainly want to track transactions, revenue and leads. But we learn so much more from our tests.

Conversion-Scientist-Podcast-Logo-1400x1400


Subscribe to Podcast

In my new Marketing Land column The Multi-Goal Magic Of Split Testing Software, I describe how we use some of these goals to find sweet spots in a website.

  • Find out how to “light up” a funnel that is invisible to analytics.
  • Discover the pages are most influential in converting.
  • Segment your audience based on their behaviors.

You can listen to the column or read it for yourself.

Brian the Conversion Scientist is always excited to share his knowledge about website optimization. He’s also an entrepreneur just like his clients. Dr. Jeremy Weisz from INspired INsider interviewed Brian about his highest and lowest points leading his business.

Brian talks about client negotiations, how he feels about his employees (hint: nothing but good feelings!), and advice for making a better website.

Listen to the full podcast or read the transcript: it’s educational and unexpectedly touching.

Conversion-Scientist-Podcast-Logo-1400x1400


Subscribe to Podcast

Transcript

Jeremy:
Brian, since it’s INspired INsider, I wanted to hear about what’s been a really low moment and how you pushed forward through it, and then on the flip side a proud moment.

Brian:

I think our lowest moment would have to have been when we signed up a do a pay for performance.  We had a deal where we were being paid a retainer, and we also got a bonus based on how much we increased their conversion rate.

And as you can imagine on a complex site, it’s really hard to determine how much of a conversion rate increase is due to the market, how much is due to promotions the company was going to do anyway, and how much of it is due to us. But we came up with the formula that would take several different measurements and average them, and if it went to this certain point then we got a certain percentage of revenue.

We had a month go by, and there was a huge increase; it looked like our bonus was going to go through the roof. We had just started, and we know we didn’t make any changes. So we started working vigorously and the next month, they had some specials, and again we had a bonus that was just through the roof.

We felt like we had to stick by our guns because that was the agreement.  I mean if every time the bonus coincidentally was in our favor was early on – rather than being lower early on – then we wouldn’t have much of a leg to stand on for future agreements like this one, which by the way we don’t do anymore.

It ended up being a very confrontational negotiation. It came to a good settlement, and we lost a customer. We lost a very interesting customer at that. So that was kind of the low point.

Jeremy:
You mean that they said it wasn’t due to you, so they didn’t want to pay you the bonus?

Brian:

That’s right.

Jeremy:

That’s painful.

Brian:

We said “You might be right it: it may not be due to us or not all of it, but the agreement says this is how we calculate the bonus.” That was the agreement: we’re going to calculate it using this formula. We had offered to cap it, and they said “No, we want you guys to be motivated to really make us rich.” And I think we could’ve, and I wish we had been able to keep going with them.

Jeremy:

How do you navigate that type of negotiation because it is a client relationship, but then also you deserve to be paid a certain amount. I’m sure this happens all the time in a lot of business type of situations. How did you come to the table, and how did you handle the negotiation? Is that an easy process?

Brian:

I think probably the most important thing we did is we got on a plane and flew out there. Being face-to-face made it more confrontational but realistically confrontational. There’s an amazing ability of the human mind to read somebody’s face, so that’s what we decided to do rather than trying to read their voices and faces over the phone. I think that was probably the most important thing.

We never wavered, but we did compromise. We didn’t get the full bonus, but we told them what we were willing to take. We did a good job making our case for it. And you know I think that’s all you can do.

Jeremy:

What would you tell someone if they experience the same situation – someone backs out of an agreement? What advice do you have for them?

Brian:

We talked about litigation, but we didn’t see that as a tactic, and we didn’t use it. I think holding the other side to their highest – even when they get heated and when they sound irrational to you – assume that they’re working for the best, and they’re working for the fairest.

There’s a fundamental difference in the way people will behave if you expect a certain thing from them.

Even in a business situation sometimes somebody’s job is on the line, and they negotiated a bad deal with you. We had one other situation where they said “We didn’t know you were going to charge so much. We didn’t quite understand the agreement.” It was a much smaller amount of money, but hold them to their highest and plan ahead of time where your concession points are. Tell them how much you’re willing to concede and concede slowly. So if you’re talking about $100,000 deal, your concession points are going to be in the $99,000 or $98,000 range.

And don’t worry about seeming unreasonable. You can keep going, but that’s where really where you find out where their concession point is. Find a compromise that you both feel like “I can take that.”

Jeremy:

Lesson learned. Now you don’t do pay for performance.

Brian:

Pay for performance has potentially two outcomes with the wrong organization. I wouldn’t rule it out categorically, but number one, you are wildly successful with them, and you become too expensive to be kept on.

Or number two, you don’t you have inclusive tests for a long period of time, so you’re not making any money with them.  Your employees begin to think “Well I’m making money over here with this other client, so I’m going to spend more time on that.” So it never actually gets its fair shake past some of those early failures.

So no it doesn’t work. We do flat rate, fixed price consulting. We don’t even do hourly. It’s a flat rate. It gives us the freedom to do as much as we need to do to delight the customer. And so that’s what you want. You want someone who has the resources to really put a lot of money in your pocket.

Jeremy:

I can see with the first deal the guy made with you that they want you to be motivated, so they didn’t want to cap it which I would think makes perfect sense.

So what about the proudest moment?

Brian:

I think that there have been a number of proudest, but for me the proudest has been really over the last six months. We’ve brought on a new Conversion Scientist, and we’ve had one who has been with us for longer, but the two of them really have delighted clients. They’ve been able to come in, get up the learning curve on reading the tealeaves that are the analytics and all the other research that we do, then consistently deliver wins.

In one case, we started off very rough. We had a couple of inconclusive tests.  These were language tests, and we were changing the language on buttons for a barcode company. The control beat everything. We were struggling to get statistical significance because there was also a little bit of “Should we go with this conclusion or not go with this conclusion?” It just felt very rough, so to be able to turn that around and turn it into tripling the conversion rate, it just feels great. We were running on kind of a high.

We’re in demand, and our process is really working. We do have tough clients in other sectors, but it just feels great to see other people catch the disease that I got back in 2006 of “Oh my gosh! This brings everything together!” The data, the technology, the development, and the entrepreneurial side. We’re really scrambling to make more money for our clients, so to see that excitement pop up in your employees feels really good.

Jeremy:

Is it hard to get clients to listen? When you triple conversions they probably say “I’m all ears” but before that in the initial tests, I would think it’s hard to convince them you should do things a certain way for a long time if you have these inconclusive paths.


21 Quick and Easy CRO Copywriting Hacks to Skyrocket Conversions

21 Quick and Easy CRO Copywriting Hacks

Keep these proven copywriting hacks in mind to make your copy convert.

  • 43 Pages with Examples
  • Assumptive Phrasing
  • "We" vs. "You"
  • Pattern Interrupts
  • The Power of Three

"*" indicates required fields

This field is for validation purposes and should be left unchanged.


Brian:

There is a lot of back and forth. Some clients begin to get excited and they come up with their hypotheses, and then we say “We have some of this data from a previous test” or “We saw this over here that says it’s probably not a good hypothesis”. But then other times a client will come to us with a great hypothesis, and we’ll think “Oh my gosh why isn’t that on our list?”

That conversation usually works out well, but what is harder are situations like when we had a client that sold sports memorabilia online. Customers were going to the purchase page and adding something to cart.  They’re buying; they are going through the process. Then customers change the state that they live in, so the terms of the shopping cart change, and one of those little twirling rings goes off while it’s going to the database and grabbing the new tax information.

In Internet Explorer, that twirling ring didn’t go away, and it was spinning right next to the credit card number field. Imagine this: you’re about to enter your credit card number, but you’re not about to enter it until the browser says it’s ok. It’s spinning about 30 seconds then another twirling ring pops up, and now you’re thinking “I’m not going to give my credit card to these bozos”. Thirty seconds later, another twirling ring. So you have three of these spinning things.

We decided to design some java script, and we fixed it. We actually ran a test because we wanted to see how big of an impact this was having because this problem was at the buy point.

It was costing them over $1,000,000 a year in revenue!

Jeremy:

Wow that’s amazing.

Brian:

We presented this to them, and they were like “ok”.

So then we were thinking, “Wait a minute, what’s going on here?  Why aren’t they more excited?” When we see a test that delivers a 25% increase, when we put it on the site it’s generally going to see a 10-12% increase in actual. There are a lot of other things come into effect and change the results, and you know 25%? That seems ok.

So with the sports memorabilia company, we were thinking, we just made you a million and a half dollars, worst case, and you’re not really reacting. That’s more perplexing to us, when they have no reaction.

Sometimes the person you’re dealing with within an organization is more worried about their job instead of what we’re doing.  In enterprise organizations it really is about career advancement, and you can tell that this is not something that they think is going to help get them ahead. They’re just not as excited.

Jeremy:

It’s not their business.

Brian:

It’s an individual or someone who reports directly to the CEO or something. So that’s more frustrating. We’re rah rah’ing, and it’s silence on the other end, and you’re wondering what’s going on. They should be hiring a marching band and marching through our office.

Jeremy:

They’re covering the phone and just screaming or something.

Brian this has been an absolute pleasure. Where can we point people towards? Where should people go to check out more?

Brian:

You know everything we learn, we write about. We’re really a teaching organization because that’s what it’s going to take to get more of these websites up and optimizing. So come to Conversion Sciences.

We post several times a week there: case studies, head-scratchers, things we’ve learned, audio, there’s a lot of video, we’ve got a podcast if you like to listen to things on the commute. And you know we’ve got the data that answers some of the questions that I know are burning in your little brains.

Jeremy:

Conversion Scientist.  Yeah, I was reading one this morning: why no one is reading your emails.  That was a good  one.

Brian:

Everything is fair game.

Jeremy:

So any final thoughts?

Brian:

Entrepreneurs: those of you who are embarking on any business right now are going to have a website to support it. I can’t think of an exception. And you’re going to go hire a web developer or maybe do that yourself. And a designer to tell you what to do. A marketer today is not going to be able to go off and do that anymore but the good news is that the data is readily available.

Even if you’re a little afraid to get a little math-y and maybe understand a little statistics, I strongly recommend that you go and poke around in analytics. Make sure that you’ve got Google Analytics – which is a free tool – installed and start building this database so you can test yourself. That’s where it all starts. Start poking around; I know us entrepreneurs are pokers. We’re going to get to know just enough about a space that we feel confident either winging it or competently hiring someone who can do it for us. You need to be doing that on the site because it will accelerate your growth, especially out of the gate when those few precious leads, few precious sales, few precious users will make or break your business.

Jeremy:
Awesome Brian, thank you so much I really appreciate it.

Brian:

Thanks for having me man. Glad I could come.

The knockout punch came near the end of the webinar. Who won, UX or CRO?

Watch the Webinar Replay

Listen to the Podcast

We shot this webinar because I had two things happen in the past year that made me wonder if we shouldn’t be doing more UX as a part of our CRO efforts.

First, we helped redesign a client site using conversion optimization. During the redesign, the client experienced significant increases in demos and sales of its software. To date we’ve almost tripled their demo requests.

Then, I happened across a landing page that I felt was very well done. When I asked the designer of that page how they had arrived at that design, Adam Treister told me they had done a UX process on it. And he had documented the process in a Udemy course. The page increased enrollment clicks by 246%.

Two different approaches. Two great results. I invited my UX friend Sarah Jabeen of DiscoverSTEAM to debate this with me. How are these two process different? How are they the same?

There is only one way for you to find out.

Conversion-Scientist-Podcast-Logo-1400x1400


Subscribe to Podcast


21 Quick and Easy CRO Copywriting Hacks to Skyrocket Conversions

21 Quick and Easy CRO Copywriting Hacks

Keep these proven copywriting hacks in mind to make your copy convert.

  • 43 Pages with Examples
  • Assumptive Phrasing
  • "We" vs. "You"
  • Pattern Interrupts
  • The Power of Three

"*" indicates required fields

This field is for validation purposes and should be left unchanged.


The fight for online leads and sales has traditionally been fought at the search engine. That is changing.

Web analytics, bid management, competitive intelligence, ad testing and ad management tools are all common staples of any serious paid search effort. Return on ad spend (ROAS) is being tracked all the way through the sign up or purchase process and ad strategies are being adjusted accordingly.

Quietly, the battle for online leads is moving to a new front. This new front is measured by revenue per visit, and it’s kissing cousin, conversion rate. Like the tide that floats all boats, website optimization is being seen as the way to reduce all marketing costs by dropping the acquisition cost of new prospects and customers.

Why do we say this is happening quietly? That is the conclusion we came to when examining an unusual data set from SpyFu.com. We were able to determine which businesses had conversion optimization tools installed on their website. This, we reasoned, gave us a pretty good idea of which businesses would dominate in the world of online marketing — assuming they were actually using the tools.

Conversion-Scientist-Podcast-Logo-1400x1400


Subscribe to Podcast

In this month’s podcast, based on the Marketing Land column Data Exposes Scandalously Low Adoption Of Conversion Optimization Tools, Brian the Conversion Scientist explores the usage of conversion optimization tools for two industry segments: Higher Education and B2B Software.

In one report, 73% of businesses are spending between $500 and $5000 per month on paid search ads. Almost a quarter are spending between $5000 and $50,000 per month. Yet, only 14% of businesses have at least one website optimization tool installed.

Who are going to be the winners in this new front? Where does your business fit in this statistic?

The little yellow message in the upper right corner of your Google Analytics report can be somewhat unsettling. It appears when you use custom segments on a website has grown to hundreds of thousands of hits. The message is a warning you that the report you’re looking at is based on sampled data.

Does this mean the data is wrong? Can you use it to make decisions about your site? Can you share it with your boss?

The answer is, “Sometimes.”

In my article Everything’s Bigger In Texas: Sampling & Google Analytics Reports, I’ve drawn three conclusions that, if kept in mind, will make sure your reports are telling you the truth about your website — or something close to it.

Conversion-Scientist-Podcast-Logo-1400x1400


Subscribe to Podcast

1: The Amount of Data Affects Sample Size

The percentage of pageviews that Google Analytics reports in the yellow box can tell you how accurate your report may be. The more data that Google has to analyze, the longer it takes.  So, if your report covers a larger the time, the sample size Google Analytics uses will be smaller. For certain types of reports, you’ll be limited to 90 days.

2: Use Sampled Reports for Large Datasets Only

If the number of datapoints in your segment is low, you will find the data in your reports to be less accurate. A report with on a segment with 50,000 sessions that is sampled may produce nothing but noise. I show you how to determine this in the column.


21 Quick and Easy CRO Copywriting Hacks to Skyrocket Conversions

21 Quick and Easy CRO Copywriting Hacks

Keep these proven copywriting hacks in mind to make your copy convert.

  • 43 Pages with Examples
  • Assumptive Phrasing
  • "We" vs. "You"
  • Pattern Interrupts
  • The Power of Three

"*" indicates required fields

This field is for validation purposes and should be left unchanged.


3: Dialing Up the Sample Size Helps

“Moving your sample rate from 5% to 10% feels pretty insignificant.  It’s not, especially for segments that return smaller datasets.”

The larger your sample size, the more you can rely on Google’s reporting because the bigger the sample, the clearer the picture that analytics will be able to make using the data.

When your website grows beyond a certain point, Google Analytics is going to start taking shortcuts. 

Don’t be the victim of a big Google Analytics lie
Don’t be the victim of a big Google Analytics lie. Know what those shortcuts are and know how to get around them so that you are relying on data that tells the true story.

There are special visitors on your site right now. They blend in with all of the others in your analytics, but they behave differently from the others.

They visit more pages, spend more time, share more often and are more likely to buy from you.

Would you like to know them better?

Would you like to know how to treat them better?

Would you like to have more of them?

Conversion-Scientist-Podcast-Logo-1400x1400


Subscribe to Podcast


Transcript

These visitors are your account holders. Some have bought from you. Some have not.

Account holders should walk around your site in their socks on the plush red carpet you’ve laid out for them.

  They’ve put forth more effort interacting with your site than your other non-buying site visitors because they’ve shown you buying intent.  And that’s a big deal for you.

In my Marketing Land column Use Google Analytics To Treat Your Account Holders Like Royalty I show you how to isolate these wonderful visitors and see how they behave.

What is tripping them up?

Where do they come from when they visit?

Do they respond to email?


21 Quick and Easy CRO Copywriting Hacks to Skyrocket Conversions

21 Quick and Easy CRO Copywriting Hacks

Keep these proven copywriting hacks in mind to make your copy convert.

  • 43 Pages with Examples
  • Assumptive Phrasing
  • "We" vs. "You"
  • Pattern Interrupts
  • The Power of Three

"*" indicates required fields

This field is for validation purposes and should be left unchanged.


Why does the “online” marketer have to do something different from the “other” marketers at the beginning of a new year?

There are many reasons.

The online marketer is blind without accurate data.

The online marketer has wrested control from the grubby hands of IT.

The online marketer knows that

the seeds of holiday regret are planted in February procrastination.

Conversion-Scientist-Podcast-Logo-1400x1400


Subscribe to Podcast

Don’t worry. We’ve prepared a list of seven things you should do now at the beginning of the new year.

Resolve to optimize the website before the next holidays

“If only” are the saddest two words in the English language.

If only we had a little higher conversion rate from all of that juicy holiday traffic.

If only Black Friday had put us a little more “in the black.”

If only our shopping cart had worked with Internet Explorer.

We know that the holidays are happier when we get more revenue under the Christmas Tree. This year let’s start getting more from the traffic we’re going to get next November and December.

Testing and optimizing does take time. Now is the time to start testing if you want your holidays to be merrier.

Change the passwords on your testing tools

The modern marketer has taken control of much of the website from the grubby hands of IT and the web developers. Today, tag managers give marketers an unparalleled ability to add measurements to a site without IT’s help. Split testing tools allow them to transform a website for a particular group of visitors at will.

With great power comes great responsibility.

Many marketing departments should adopt the best security practices of their IT brethren. If a malicious individual got the password to Optimizely or Visual Website Optimizer, they could wreak havoc on the site at will.

Go ahead, change your passwords. And make them good passwords. We use the program PassPack to store and share hard-to-crack passwords with our team.

Check that all your pages still have analytics and testing software

A website is a complex piece of software. New pages are added by different stakeholders. Changes are often undocumented. Not everyone is concerned that your analytics and testing tools need to be added to each page and then checked.

Before diving into a new year, run through the pages on your site and make sure they all have the right tools installed.

There are automated systems for checking your site, but taking some time to explore by hand is very helpful. Get ready to start a punch list.

I recommend installing two browser extensions for Chrome: Tag Assistant by Google and Ghostery. Tag Assistant tells you if your Google Analytics or Google Tag Manager installation is broken on any page, and offers helpful tips. Ghosterytells you every tag that is installed on the page, so you can check for things like Click Tracking tools, session-recording tools and more.

Consider moving to a tag manager, like Google Tag Manager. This centralizes analytics setup.

Make sure your site still works with all devices and browsers

Your analytics will tell you which browsers and devices your visitors are using on your site.

Your analytics will tell you which browsers and devices to check.

Your analytics will tell you which browsers and devices to check.

Make sure your site works on the top devices and browsers.

Year over year evaluation

The end of a year means another year of data. Woohoo!

This means we have an entire year to compare our progress against. When we compare year-over-year data, we eliminate differences that occurred due to market changes. For an online consumer retailer, comparing October performance to November performance wouldn’t be fair, since the holiday shopping season starts in November. Instead it’s better to compare October of this year to October of last year.

Here are some of the things we like to look at in our year-over-year data.

Depth of Troughs

It’s the off-season that kills us. It’s the winter months for bikini boutiques and the summer months for mitten makers. However, if we are making progress on our site, we should see less of a drop revenue during the off-peak weeks.

And with shallow troughs we often see higher spikes during prime selling or lead-gen seasons.

Increasing Revenue Per Visit or Conversion Rate

Even it you got more traffic to your website in 2014, you may not see the increase in revenue. By measuring the Revenue per Visit (RPV) and Conversion Rate (for lead generation) you can see how your efforts in 2014 added to the bottom line independent of traffic volume.

Average Order Value

When people buy from you, are they buying more or less? This is what average order value tells us. Even if your traffic was flat and your conversion rate didn’t move, you may be getting more from each customer.

Bounce Rate

If you saw an increase in traffic to the site, did you see an increase in bounce rate? The Bounce Rate measures visitors who came and didn’t stay long. They saw only one page or left before 15 seconds had passed.

Bounce rate is an indicator of traffic quality. If lots of visitors are bouncing, then you may not be bringing the right visitor to the site.

Review your idea list

Where do you keep your punch list of things to try on the site? Go find it and give it a look. You’ll find some great ideas you forgot about.

Where do you keep your ideas for a better website

Where do you keep your ideas for a better website?


21 Quick and Easy CRO Copywriting Hacks to Skyrocket Conversions

21 Quick and Easy CRO Copywriting Hacks

Keep these proven copywriting hacks in mind to make your copy convert.

  • 43 Pages with Examples
  • Assumptive Phrasing
  • "We" vs. "You"
  • Pattern Interrupts
  • The Power of Three

"*" indicates required fields

This field is for validation purposes and should be left unchanged.


We have a recipe for setting up Google Analytics when we take on a new client. A few simple things can make all the difference.

Like naming your Views so that you can find the right one easily.

Or adding a RAW data view so that you can effectively “backup” your Google Analytics information.

I address these and a few more setup issues in my most recent Marketing Land Column, A Google Analytics Setup Checklist.

Listen on The Conversion Scientist Podcast

Conversion-Scientist-Podcast-Logo-1400x1400


Subscribe to Podcast


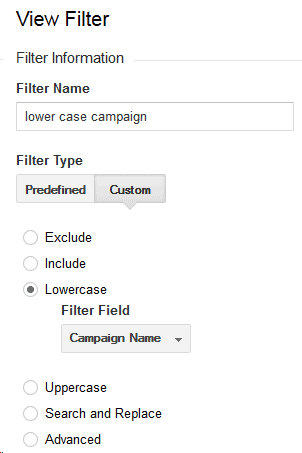
The other lower-case filters are defined as follows:

Lower case campaign

The lower case campaign filter in Google Analytics

The lower case campaign filter in Google Analytics.

Lower case Referrals

The Google Analytics filter to make the referral field lowercase.

The Google Analytics filter to make the referral field lowercase.

Related Marketing Land Columns by Brian Massey


21 Quick and Easy CRO Copywriting Hacks to Skyrocket Conversions

21 Quick and Easy CRO Copywriting Hacks

Keep these proven copywriting hacks in mind to make your copy convert.

  • 43 Pages with Examples
  • Assumptive Phrasing
  • "We" vs. "You"
  • Pattern Interrupts
  • The Power of Three

"*" indicates required fields

This field is for validation purposes and should be left unchanged.


© Copyright 2007 - 2024 • Conversion Sciences • All Rights Reserved • Conversion Scientist® is a federally registered trademark owned by Conversion Sciences. Any unauthorized use is expressly prohibited.